As the housing market moves through the final months of 2025, foreclosure data is beginning to tell a clearer and more nuanced story. While headlines often swing between extremes, the reality is more measured. Foreclosure activity is rising, but not collapsing, and the increases are concentrated in specific states, counties, and borrower profiles.
Nowhere is this more evident than in Florida.
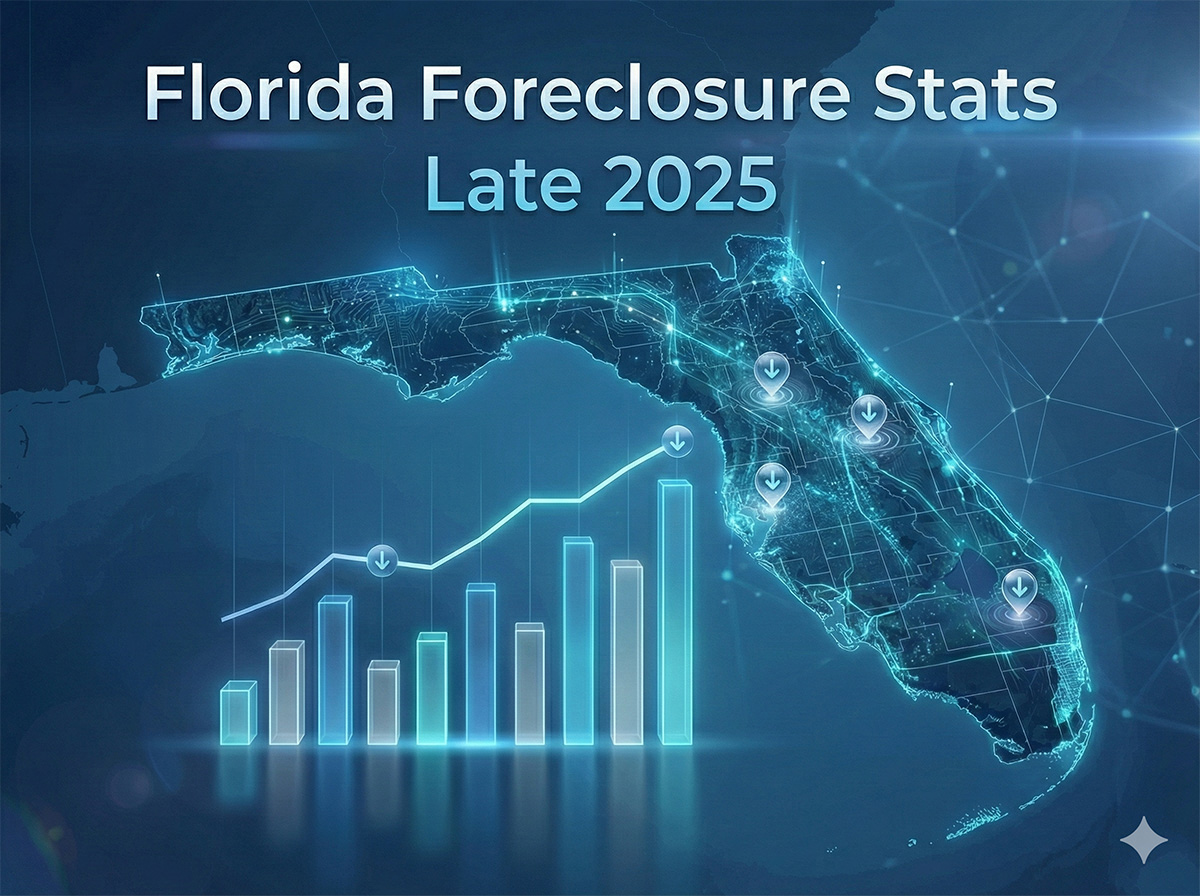
According to newly released October 2025 data, Florida once again leads the nation in foreclosure rates, standing out as both a warning signal and a case study in how market pressure builds unevenly across the country. Understanding what these Florida foreclosure stats actually represent, and what they do not, is essential for homeowners, policymakers, and investors alike.
| Rank | State | Foreclosure Rate (1 in X Housing Units) | Total Filings | YoY Change |
|---|---|---|---|---|
| 1 | Florida | 1 in 1,829 | 5,512 | +71.55% |
| 2 | South Carolina | 1 in 1,982 | 1,212 | +67.87% |
| 3 | Illinois | 1 in 2,570 | 2,118 | +32.62% |
| 4 | Delaware | 1 in 2,710 | 169 | +25.19% |
| 5 | Nevada | 1 in 2,747 | 476 | +1.28% |
| 6 | Ohio | 1 in 3,079 | 1,712 | +12.48% |
| 7 | Iowa | 1 in 3,222 | 443 | +28.03% |
| 8 | Maryland | 1 in 3,272 | 778 | +2.10% |
| 9 | Utah | 1 in 3,278 | 364 | +10.30% |
| 10 | California | 1 in 3,407 | 4,265 | -6.82% |
| Source of data: Attom Data | ||||
A National Snapshot: Foreclosures Are Rising, But Context Matters
Foreclosure activity across the United States increased in October 2025, continuing a trend that has been building gradually over the past year. Nationwide, 36,766 properties recorded foreclosure filings, including default notices, scheduled auctions, and bank repossessions. That figure represents a 3 percent increase from September 2025 and a 19 percent jump compared to October 2024
On a national level, the foreclosure rate now stands at one filing for every 3,871 housing units. While that marks a meaningful increase year over year, it remains well below the levels seen during the 2008–2010 housing crisis. This distinction is critical. Today’s foreclosure environment is not defined by systemic collapse, but by selective stress.
The data shows that foreclosure starts, which indicate homeowners entering the foreclosure process, rose 20 percent year over year, while completed foreclosures, or REOs, increased 32 percent. That divergence suggests pressure is building in the pipeline, even as lenders continue to manage inventory carefully.
Florida Foreclosure Stats: Leading the Nation in 2025
Florida posted the highest foreclosure rate in the United States in October 2025. The state recorded one foreclosure filing for every 1,829 housing units, totaling 5,512 filings statewide.
To put that in perspective, Florida’s foreclosure rate is more than double the national average. The counties driving the highest levels of activity include Osceola County, Charlotte County, and Okeechobee County, each reflecting different local pressures.
Florida’s recurring position at the top of foreclosure rankings is not accidental. The state’s housing market reacts faster to economic stress due to several structural factors. These include rapid price appreciation during the pandemic years, elevated insurance and tax costs, and a foreclosure process that moves more quickly than in many judicial states.
Importantly, Florida’s leading foreclosure rate does not mean the state is “failing.” Instead, it often acts as a bellwether. Florida tends to surface distress earlier than slower-moving markets, making its foreclosure data particularly valuable as an early indicator rather than a lagging one.
How Florida Foreclosure States Compares to Other High-Foreclosure States
Florida is not alone in experiencing elevated foreclosure activity. Several other states posted high foreclosure rates in October 2025, including South Carolina, Illinois, Delaware, Nevada and Ohio.
South Carolina followed Florida with a rate of one in every 1,982 housing units, while Illinois recorded one in every 2,570 units. Delaware and Nevada rounded out the top five, each with rates exceeding one foreclosure per 2,750 housing units.
What stands out in this ranking is geographic diversity. Elevated foreclosure activity is not confined to a single region. Instead, it spans the Southeast, Midwest, and West, underscoring that affordability pressures, higher borrowing costs, and lingering household financial strain are affecting markets nationwide.
Foreclosure Starts vs. Completions: Reading the Auction Pipeline
One of the most important signals in the October 2025 foreclosure data is the widening gap between foreclosure starts and completed foreclosures. In October, 25,129 properties entered the foreclosure process, while only 3,872 properties moved all the way through to lender repossession. This imbalance matters because it shows where the system is filling up, not where it has already emptied.
When foreclosure starts rise faster than completions, it indicates that more properties are being pushed into the legal foreclosure pipeline than are exiting it. For auction investors, this is an early-stage signal that future auction inventory is expanding, even if current auction volumes have not yet surged. In Florida, where foreclosure timelines move faster than in many other states, this buildup often translates into more scheduled auctions several months down the road, not immediately, but predictably.
This dynamic also explains why rising foreclosure numbers do not instantly produce better deals. As the pipeline fills, new auction listings tend to appear gradually, while bidder attention increases much faster. The result is often a period where choice increases before pricing becomes rational, rewarding investors who are prepared to evaluate more properties without feeling pressured to bid on marginal ones.
For experienced auction buyers, the takeaway is not to chase volume, but to prepare for it. A growing pipeline means more opportunities to be selective, more chances to spot patterns at the county level, and more value in early research. Investors who understand where properties are entering the system today are better positioned to identify which auctions are worth pursuing when those properties eventually surface, and which ones should be avoided altogether.
County-Level Foreclosure Data: Where the Real Insights Live
Statewide averages can obscure the most actionable information. Within Florida and other high-ranking states, foreclosure activity is often concentrated in specific counties rather than spread evenly across metro areas.
For example, Florida counties with relatively modest populations can post disproportionately high foreclosure rates due to factors such as investor-heavy ownership, high HOA exposure, or localized employment shocks. Meanwhile, some large metropolitan counties may appear stable on the surface while smaller surrounding counties experience sharper stress.
This uneven distribution reinforces the importance of granular data. County-level foreclosure trends often reveal emerging risk, and opportunity, long before it becomes visible in statewide statistics.
What’s Driving the Late-2025 Foreclosure Trend?
Several forces are converging to drive the foreclosure increases observed in late 2025.
Higher interest rates remain a central factor. While many homeowners locked in low fixed rates, others face payment resets from adjustable-rate mortgages or second liens. Insurance costs, particularly in Florida, have surged, placing additional strain on household budgets. Property tax reassessments are also beginning to catch up with pandemic-era price appreciation, further increasing carrying costs.
At the same time, consumer credit pressure has intensified. Delinquencies in other asset classes, including auto loans and credit cards, have risen, reducing financial flexibility for some households. Foreclosures, in this context, often represent the final point of strain rather than the first.
Using Foreclosure Data the Right Way
As foreclosure starts rise faster than completions in Florida, auction investors should prioritize precision over speed. Foreclosure pressure is not evenly distributed, so county-level trends, lien position, and foreclosure type matter more than statewide volume. This phase of the cycle typically brings more auction listings first, followed by increased competition and a higher rate of bidding mistakes. Investors who slow down, filter harder, and verify risk before bidding are far more likely to capitalize on rising inventory without inheriting costly problems.
Practical “Do This Now” Checklist for Florida Foreclosure Auction Investors
- Follow county-level momentum, not statewide averages
Foreclosure activity in Florida is highly localized. Investors gain an edge by tracking counties where filings are increasing and focusing research where new inventory is forming first. Do not limit yourself to one county. - Confirm foreclosure type before researching auctions
Early identification of first-mortgage foreclosures versus HOA or junior-lien actions prevents wasted analysis and protects bidding capital. Advanced foreclosure auction investors who know how to profit from junior liens are the only ones that should research junior liens. - Expect more choices, not fewer opportunities
Rising foreclosure starts typically expand auction inventory before pricing fully adjusts. A larger pipeline rewards investors who stay selective and evaluate each deal on its own merits. - Watch repeat patterns, not one-off properties
Pay attention to plaintiffs, neighborhoods, and foreclosure types that appear repeatedly within the same county. Clusters often signal structural issues, such as HOA-driven actions or investor-heavy areas, that affect risk and strategy across multiple auctions, not just a single deal. - Use granular filters to narrow the field, not chase volume
The most consistent results come from investors who filter aggressively, focus on qualified properties, and let verified data guide bidding decisions. Learn how to filter properties not only by property specs, but also by final judgement amounts, plaintiffs, occupancy, and property title history.
What Florida Foreclosure Stats Mean Heading into 2026
The key takeaway from Florida foreclosure stats in late 2025 is not fear, but clarity. Distress is increasing, but it is targeted, manageable, and data-driven.
For investors, this environment favors discipline. Rising foreclosure volume does not automatically translate into easy opportunities. As activity increases, so does competition, and so does the likelihood of costly mistakes. Understanding lien positions, county procedures, and local market dynamics becomes more important, not less.
For homeowners and policymakers, the data underscores the need for early intervention and realistic expectations. Markets are adjusting, not collapsing, and proactive responses can prevent temporary stress from becoming permanent loss.


Comments