PropertyOnion Market Research | October 2026 | Florida tax deed auctions
Florida tax deed auction sales declined 13.7% in PropertyOnion’s October 2026 export, and third-party investors captured a smaller share of the completed sales. The dataset recorded 681 sales, down from 789 in October 2025. Outside bidders won 609 sales, or 89.4%, compared with 738 sales and a 93.5% share a year earlier.
For investors, fewer completed sales and a lower third-party share are separate findings. The first measures auction outcomes; the second shows how those sold properties were allocated among reported winner categories. Meanwhile, the median apparent discount to estimated value rose from 21.0% to 39.7% among qualifying third-party purchases. That is a screening comparison, not verified equity or profit, particularly in a market dominated by land parcels.
Research scope: PropertyOnion analyzed Florida tax deed records marked Sold or Canceled. The October 2025 export covers 10-01-2025 through 10-31-2025 and 36 counties; October 2026 covers 10-01-2026 through 10-29-2026 and 43 counties. The same 36 counties appear in both. These snapshots are not an official statewide auction census, and their differing coverage limits year-over-year conclusions.
Three findings that matter to Florida tax deed investors
1. Third-party purchases fell faster than total sales
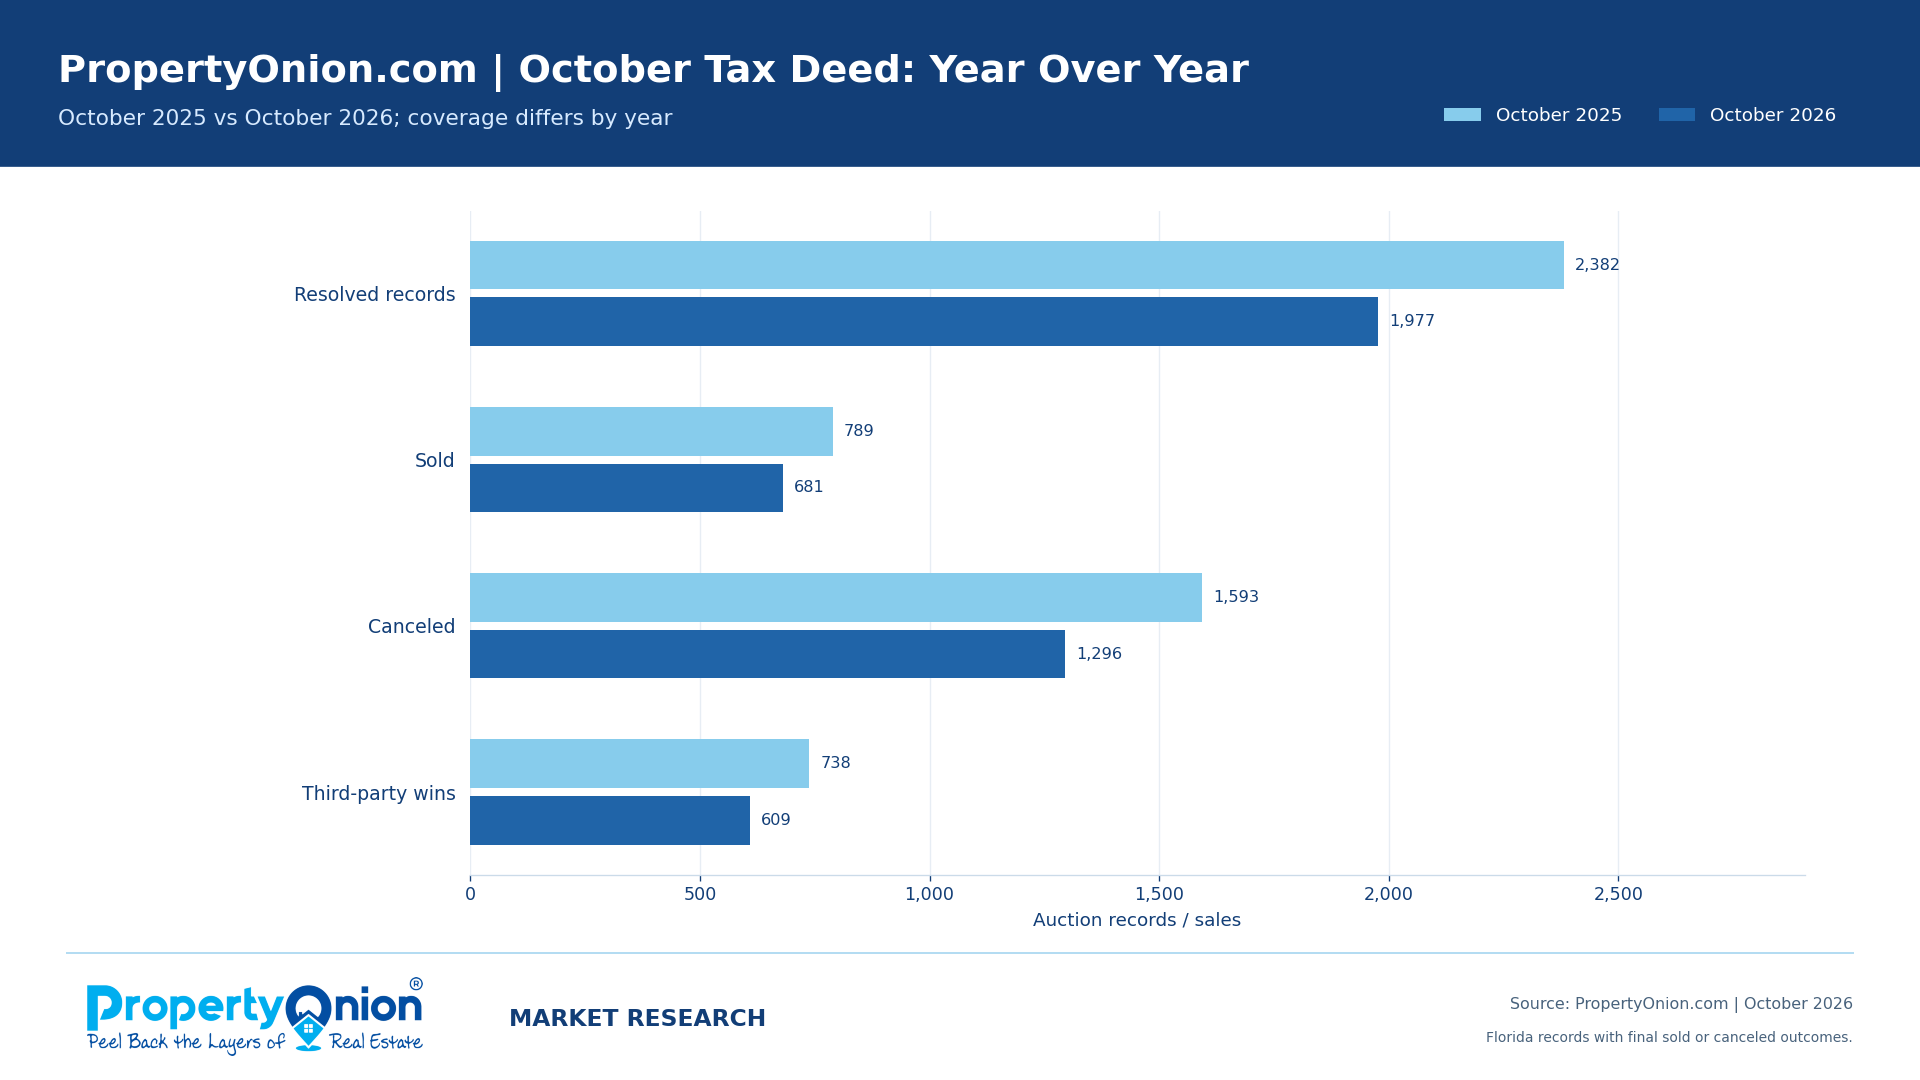
Completed sales fell 13.7%, from 789 to 681, while third-party wins fell 17.5%, from 738 to 609. The outside-bidder share declined 4.1 percentage points, from 93.5% to 89.4%. A high third-party winning share therefore coexisted with fewer recorded third-party purchases.
2. Resolved auction volume can conceal where properties sold
Duval had the most resolved October 2026 records, 216, but only 50 completed sales. Putnam recorded fewer resolved outcomes, 130, yet 105 sales and 75 third-party wins. Marion added 83 third-party wins from 83 sales. Auction volume, completed sales and third-party acquisitions measure distinct forms of market activity.
3. Apparent valuation discounts need parcel-level verification
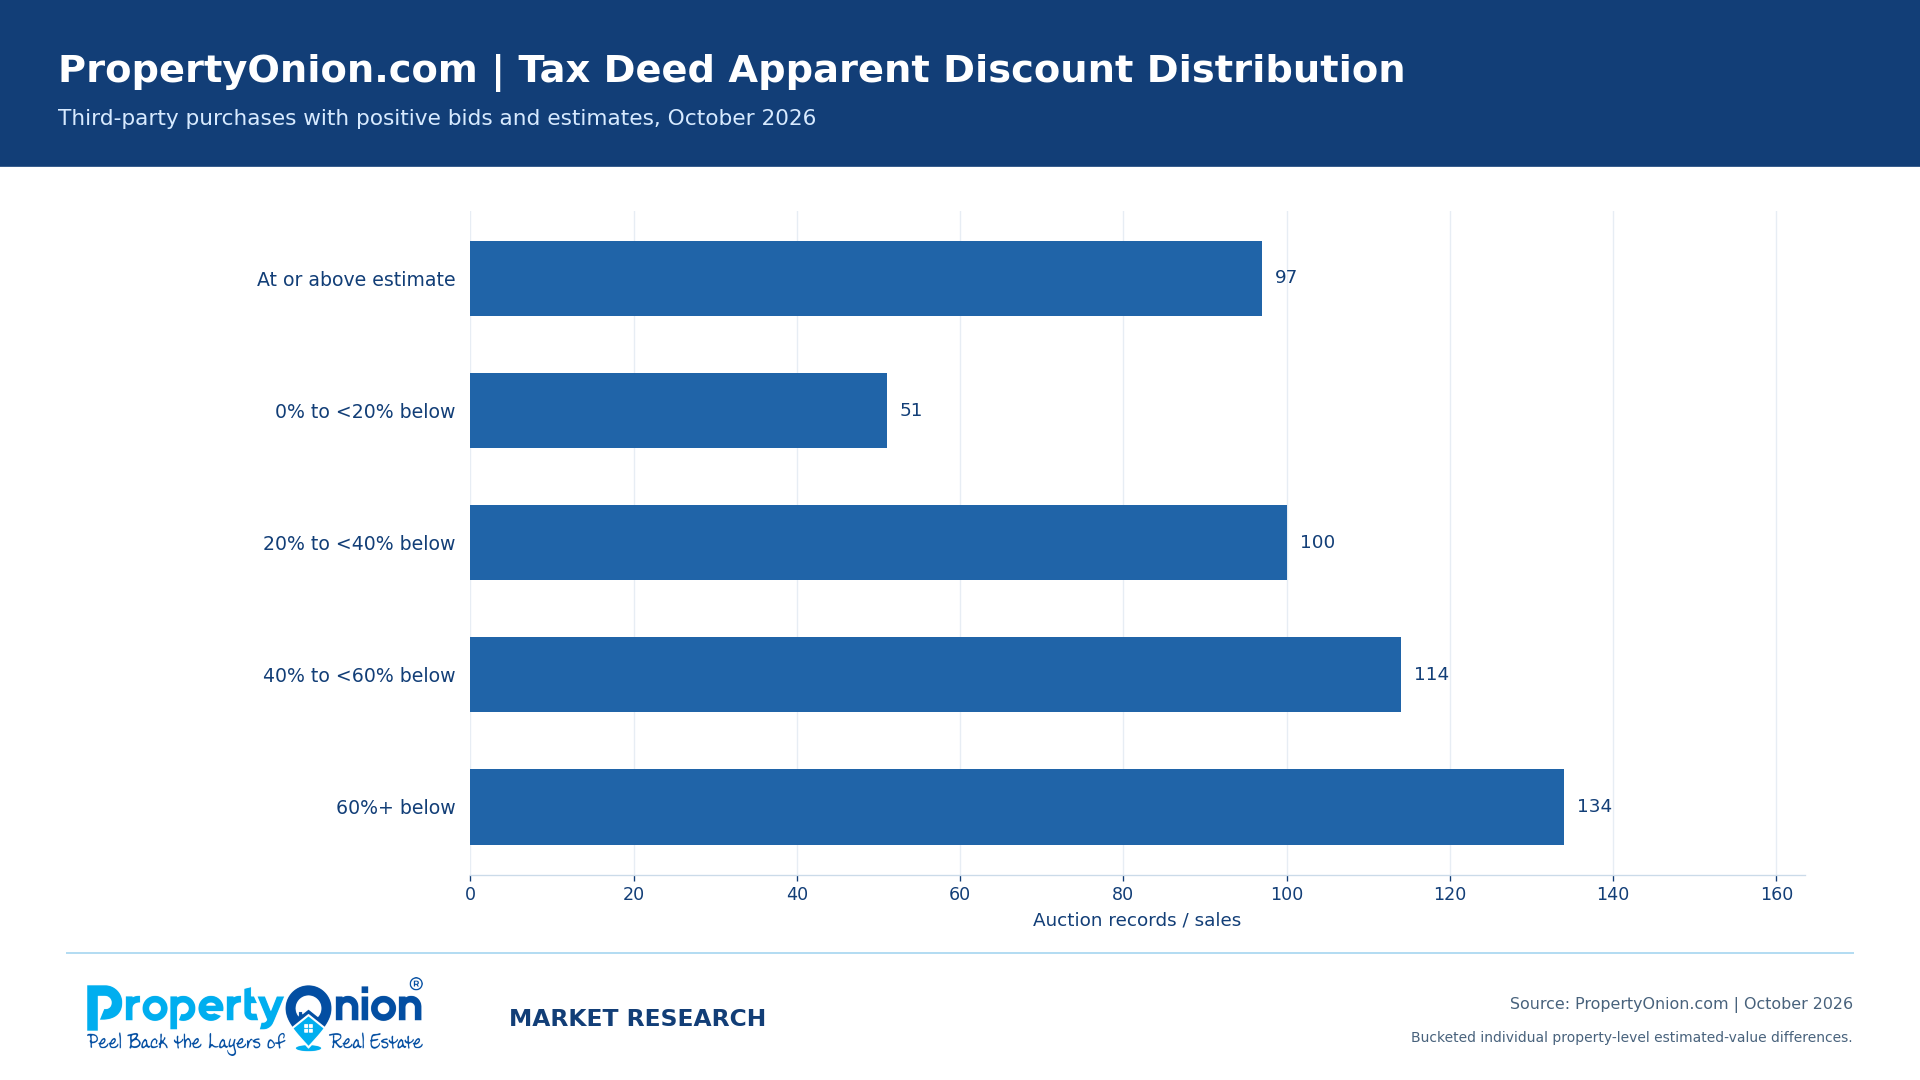
The median property-level apparent discount was 39.7% for 496 October 2026 third-party purchases with positive winning bids and estimated values. Of those, 399 bids were below the selected estimate. Such comparisons help prioritize parcel research, but they do not establish usable land, clear title, marketability or a profitable resale price.
October 2026 tax deed research at a glance
PropertyOnion.com export snapshots; not a complete statewide census. Valuation comparisons exclude significant acquisition risks.
Tax deed sales declined as reported resolved outcomes fell
The October 2026 export contained 1,977 resolved tax deed records, versus 2,382 in October 2025, a 17.0% decline. Sales fell 13.7% and cancellations fell 18.6%. This is an export-to-export comparison: county representation differs, and the October 2026 data ends on October 29 rather than October 31.
| Metric | Oct. 2025 | Oct. 2026 | Change |
|---|---|---|---|
| Resolved records | 2,382 | 1,977 | -17.0% |
| Sold | 789 | 681 | -13.7% |
| Canceled | 1,593 | 1,296 | -18.6% |
| Third-party wins | 738 | 609 | -17.5% |
| Third-party share of sales | 93.5% | 89.4% | -4.1 percentage points |
| Median apparent discount, qualifying purchases | 21.0% | 39.7% | +18.7 percentage points |
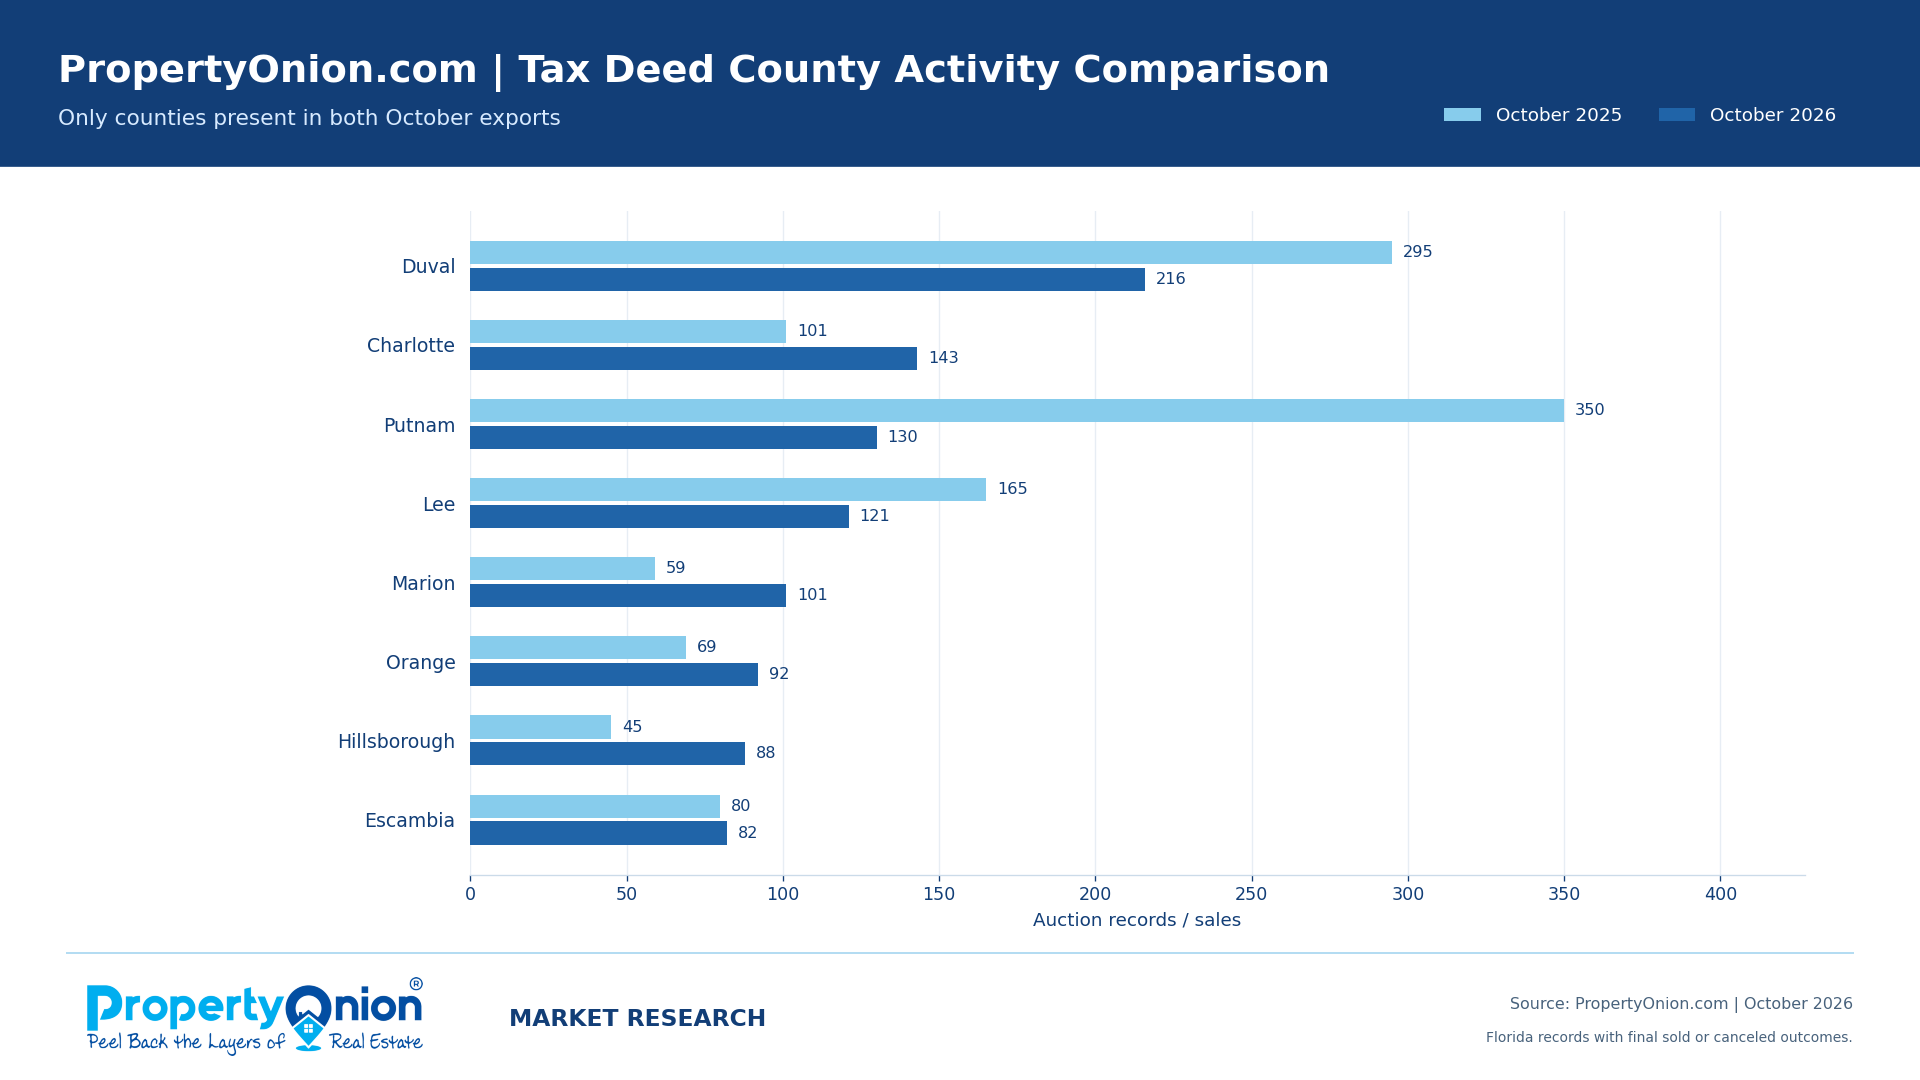
The 36-county comparison shows a larger decline in sales
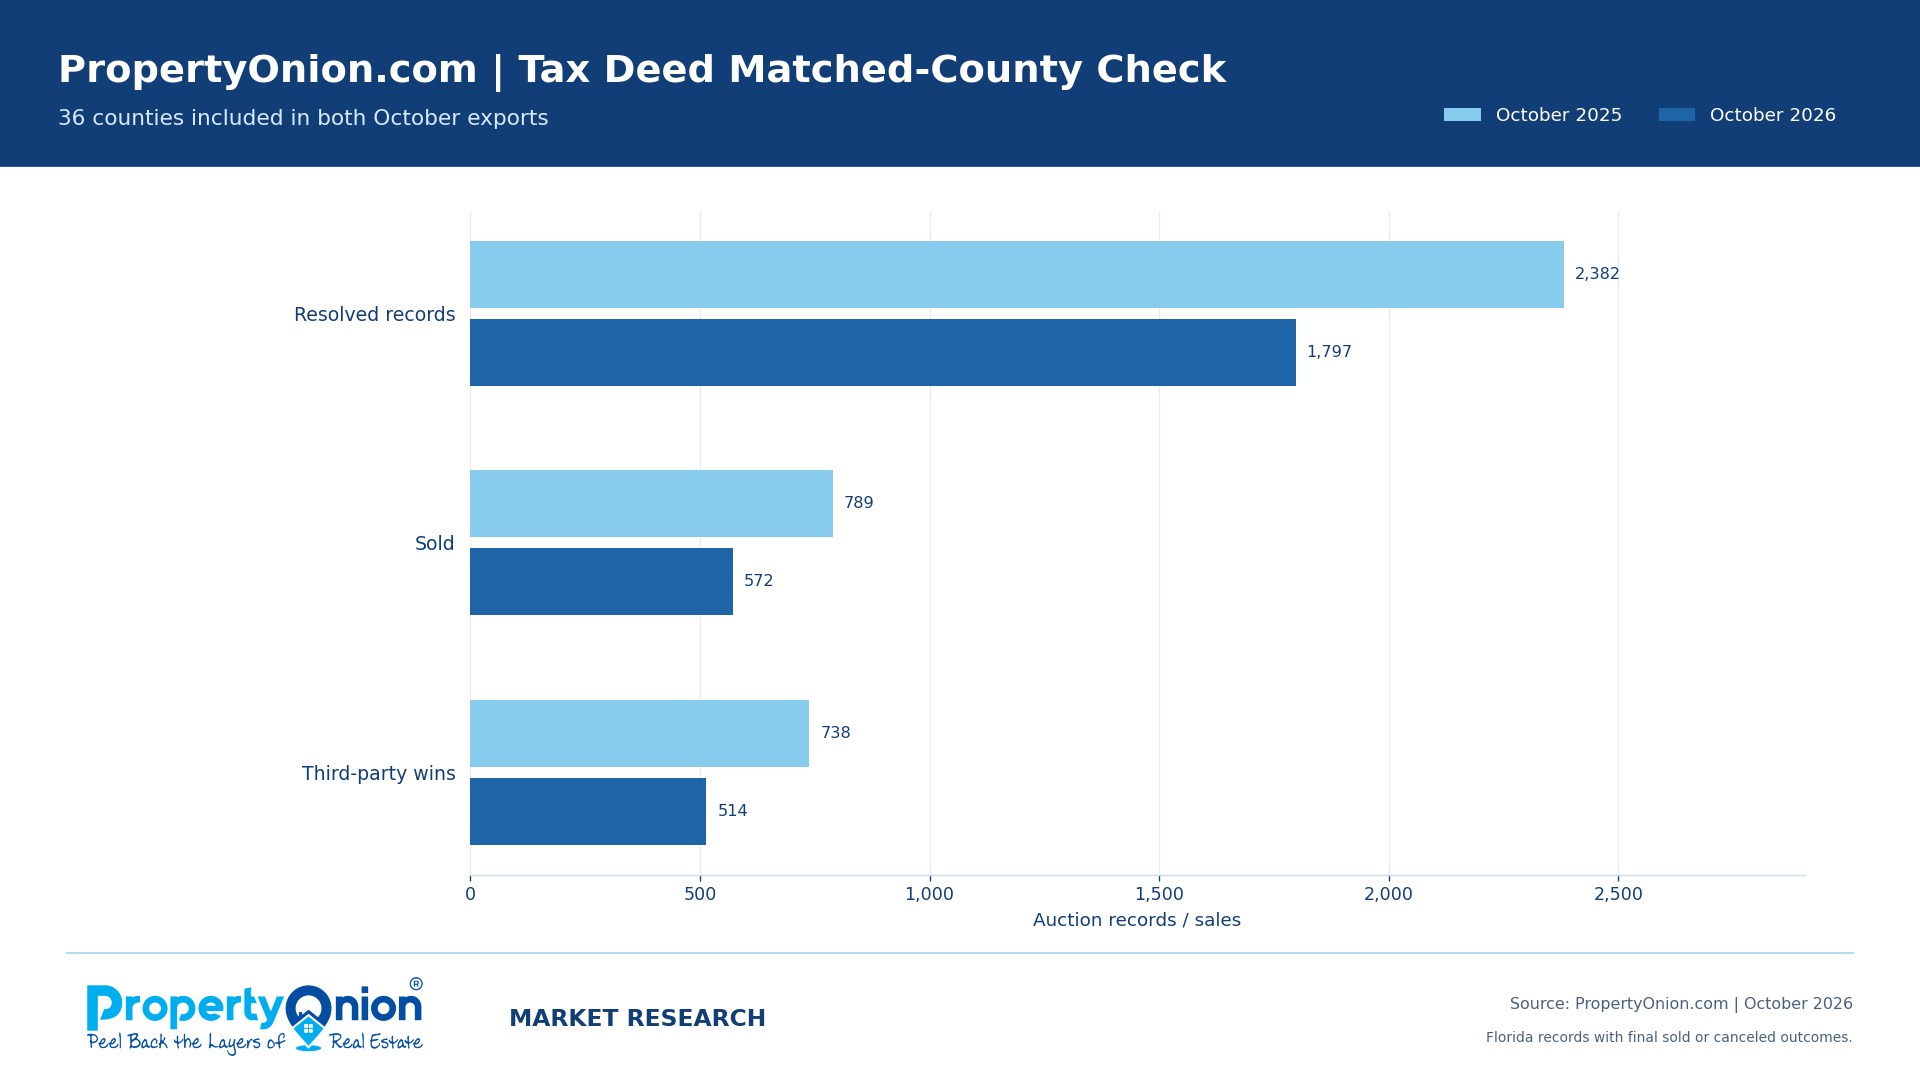
Within the 36 counties represented in both years, sold auctions fell from 789 in 2025 to 572 in 2026 (27.5%), while third-party wins fell from 738 to 514 (30.4%). The matched-county view avoids mixing different county sets, but does not guarantee equally complete records within each county or identify a cause for the decline.
About one-third of resolved October 2026 tax deed auctions sold
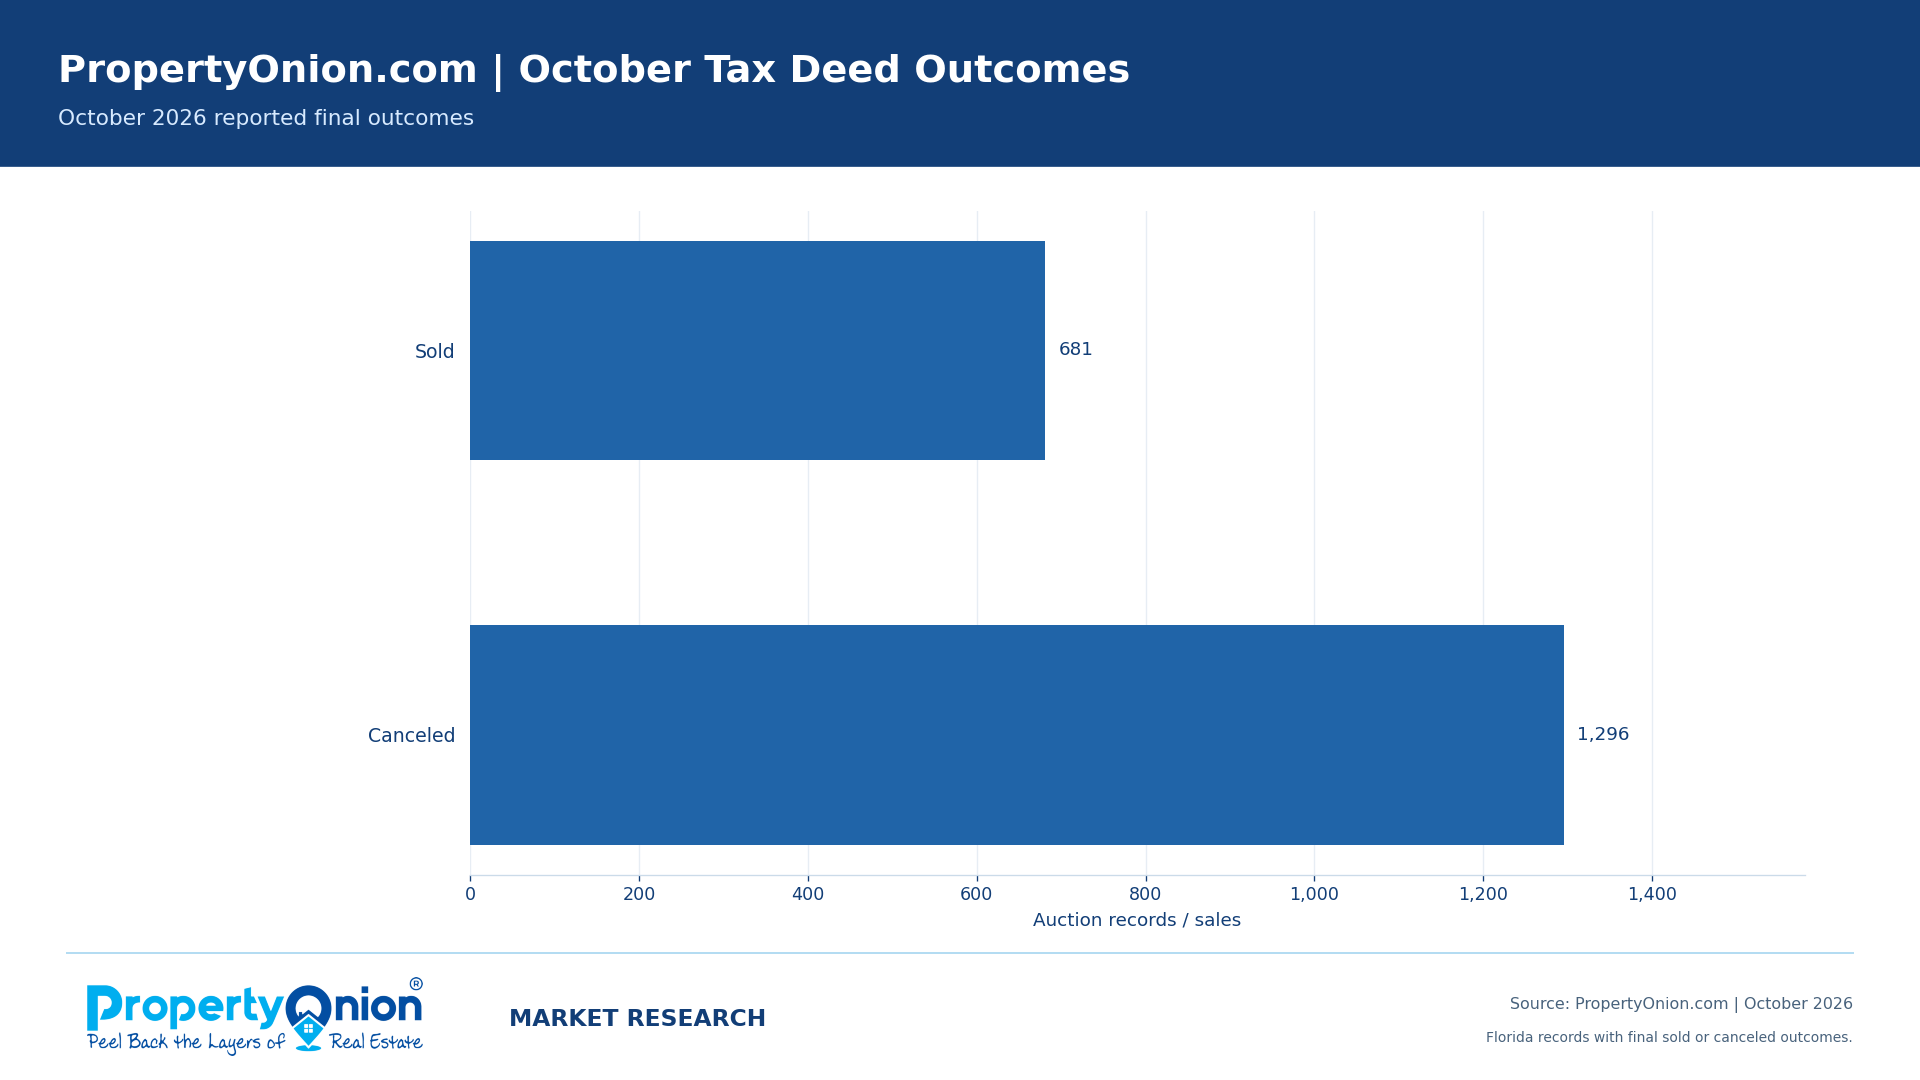
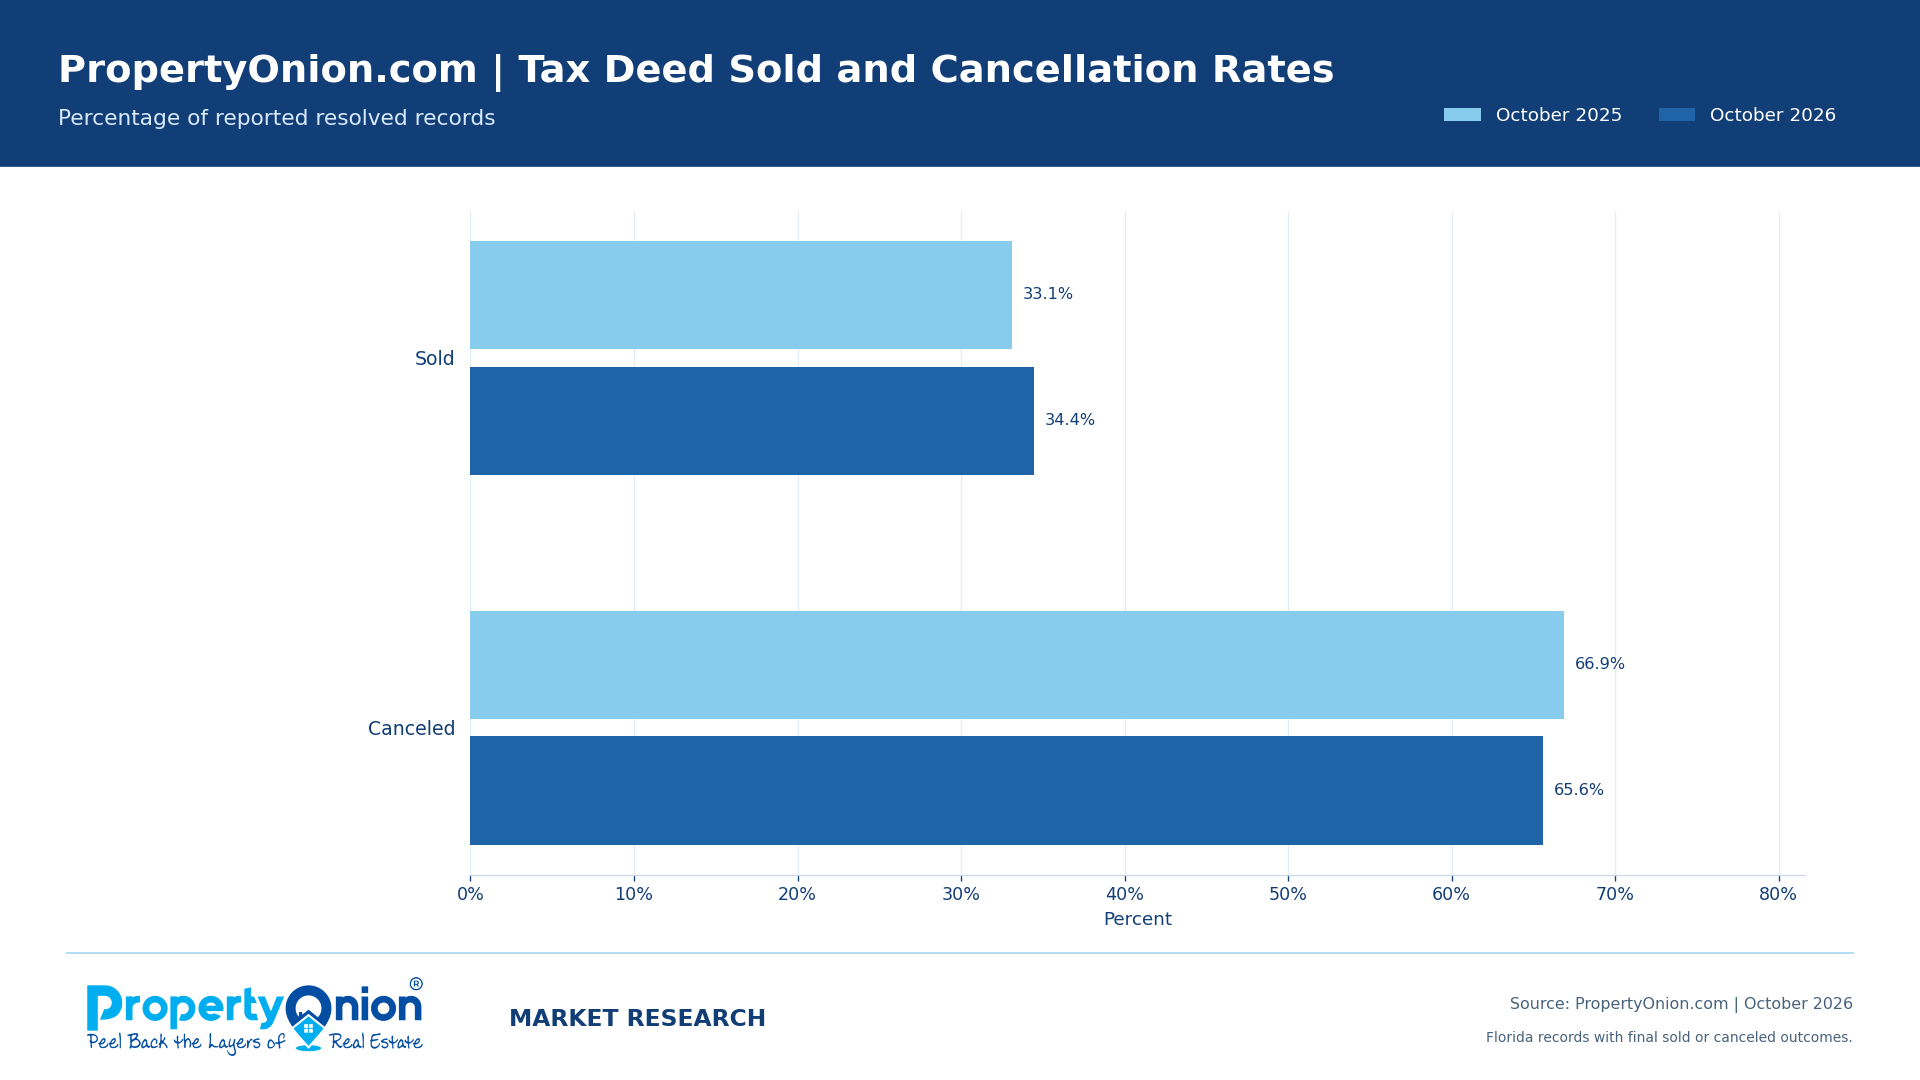
Of 1,977 resolved October 2026 tax deed outcomes, 681 sold (34.4%) and 1,296 were canceled (65.6%). Cancellations outnumbered completed sales, so counting every resolved record as a potential purchase would substantially overstate observed acquisitions. A canceled case or parcel may return on a later auction calendar.
Who acquired the properties: outside bidders or certificate-holder-coded winners?
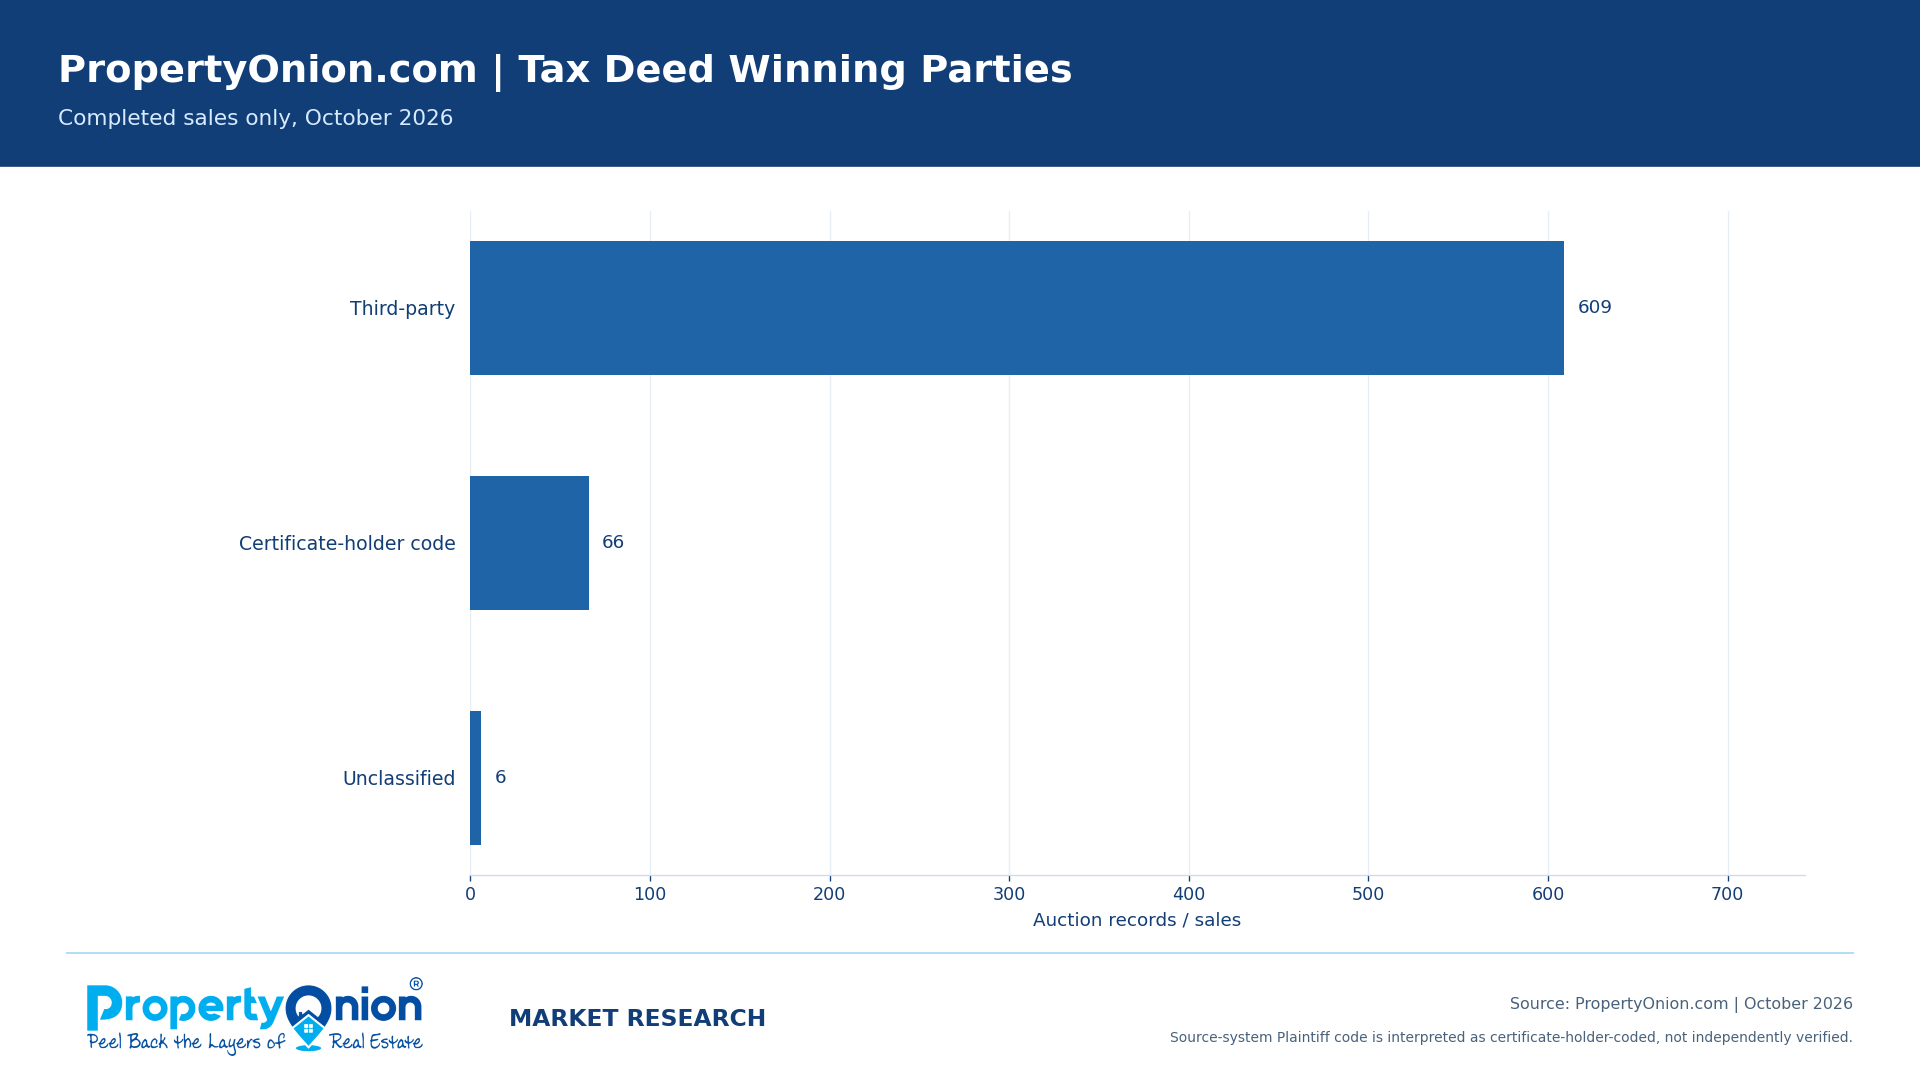
Third-party purchasers won 609 of 681 completed October 2026 sales (89.4%). Another 66 sales (9.7%) carried the source winner code “Plaintiff,” which is described in this tax deed analysis as a certificate-holder-coded category. Six sold records had no usable winner classification; all six remain in the sales denominator.
The “Plaintiff” label is a source-system code, not independent confirmation of certificate ownership, buyer identity or eventual title. The code does not establish a conventional third-party cash purchase.
County comparison: auction volume versus actual third-party purchases
The table ranks the 10 counties with the most resolved October 2026 tax deed records, combining sales and cancellations. A third-party share is calculated from completed sales, not the full resolved docket. Together, these measures distinguish where records were concentrated from where outside buyers actually acquired properties.
Scroll table horizontally to view all columns.
| County | Resolved | Sold | Third-party wins | Third-party share |
|---|---|---|---|---|
| Duval | 216 | 50 | 49 | 98.0% |
| Charlotte | 143 | 59 | 56 | 94.9% |
| Putnam | 130 | 105 | 75 | 71.4% |
| Lee | 121 | 26 | 26 | 100.0% |
| Marion | 101 | 83 | 83 | 100.0% |
| Highlands | 99 | 74 | 63 | 85.1% |
| Orange | 92 | 4 | 4 | 100.0% |
| Hillsborough | 88 | 8 | 6 | 75.0% |
| Escambia | 82 | 11 | 11 | 100.0% |
| Volusia | 74 | 11 | 11 | 100.0% |
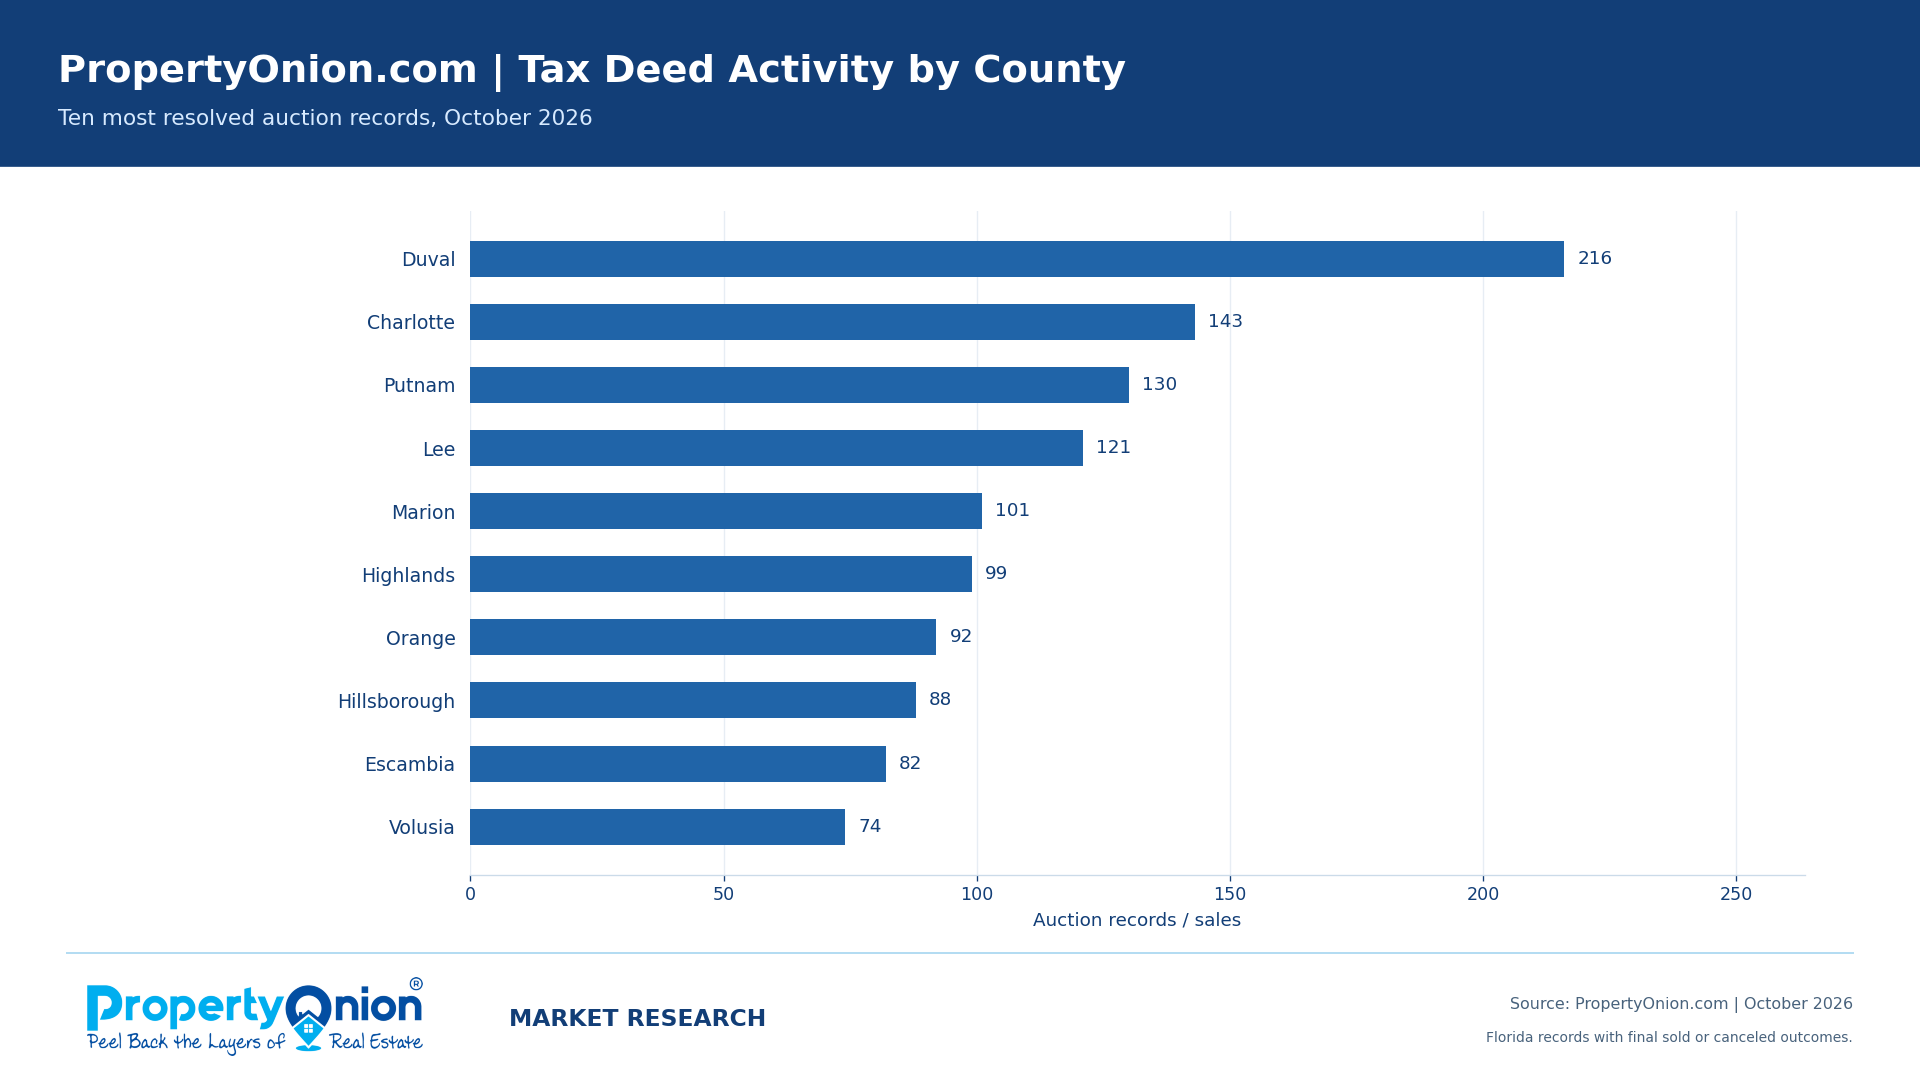
County contrasts: Duval led on resolved activity (216), while Putnam posted more completed sales (105) and more third-party wins (75). Among counties with at least 20 sales, Marion recorded 83 third-party wins from 83 sales (100.0%), Lee 26 of 26 (100.0%), Duval 49 of 50 (98.0%) and Citrus 20 of 21 (95.2%). These are observed outcomes on differing sample sizes, not forecasts of future winning chances.
Land dominated October tax deed sales, but bid levels varied
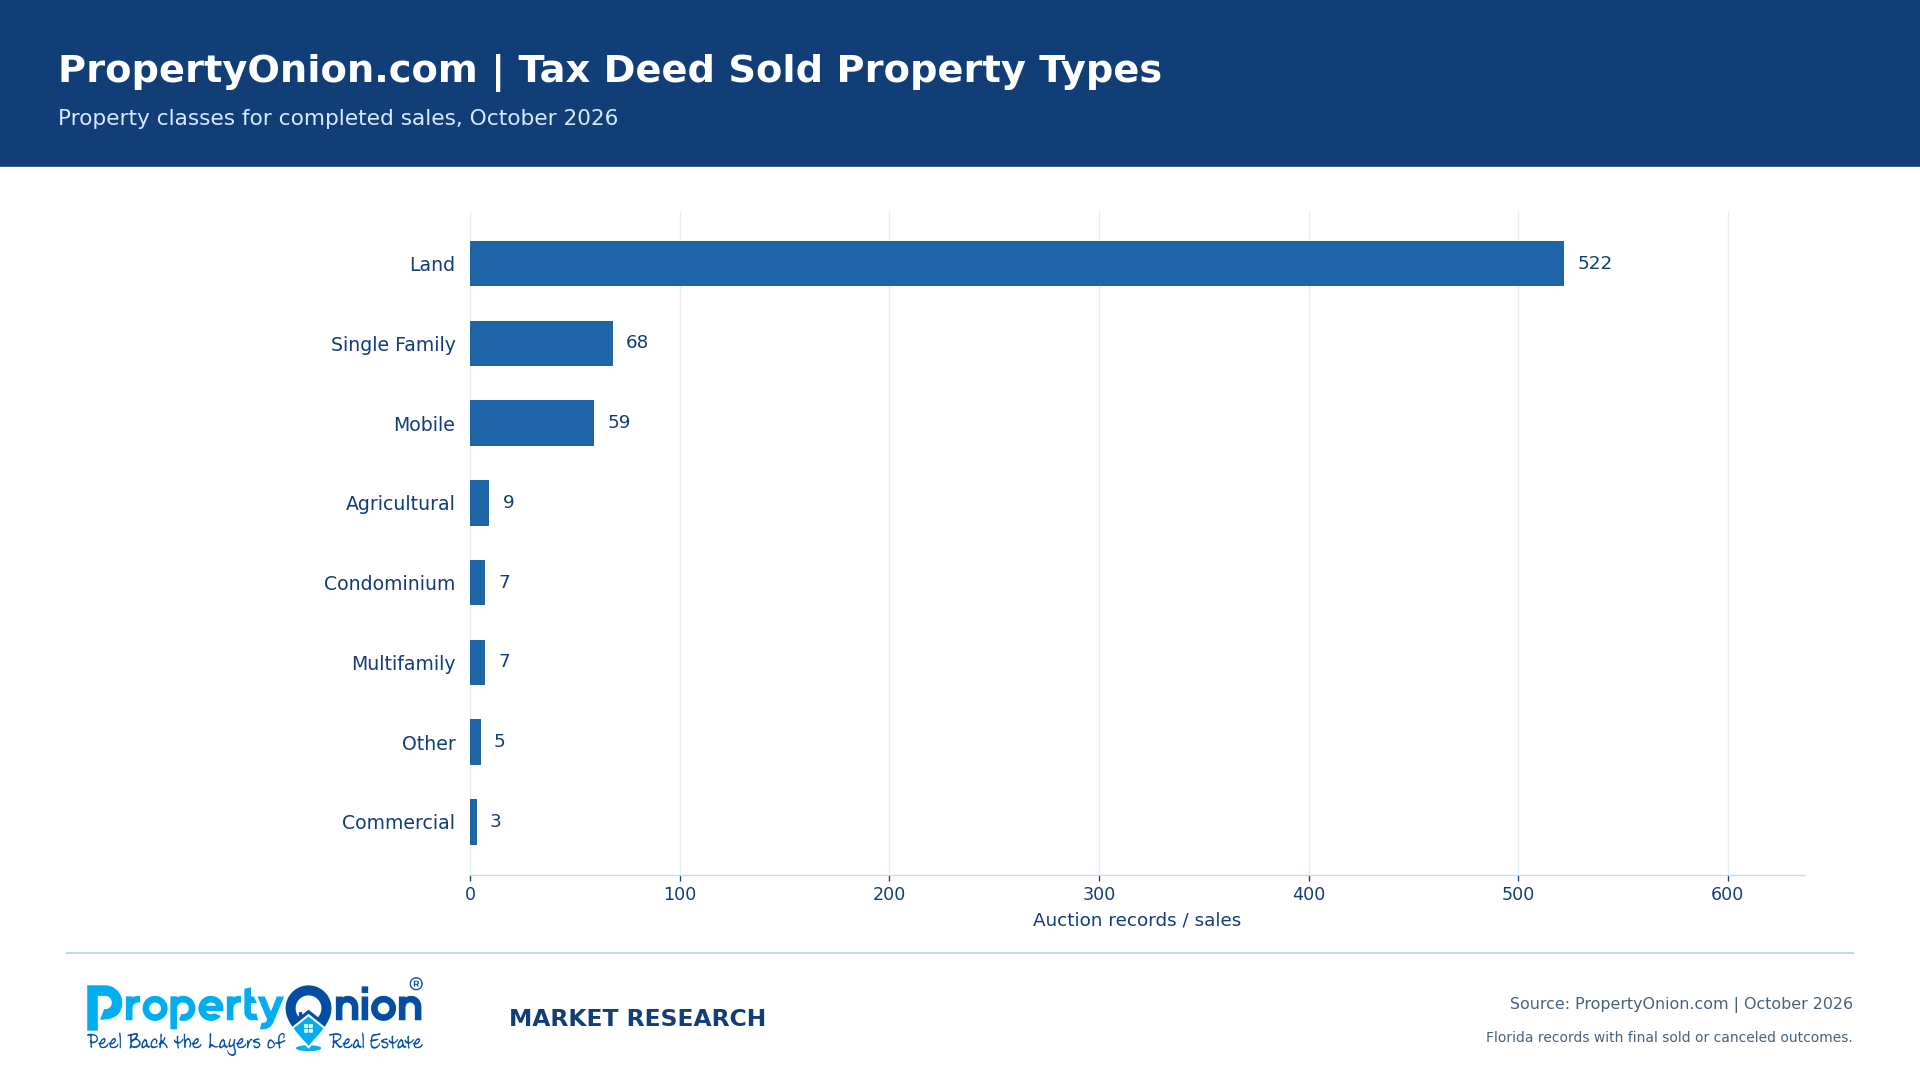
Land accounted for 522 of 681 completed sales (76.7%) in October 2026. Single-family properties and mobile properties represented much smaller groups. That mix matters: a median tax deed auction bid can conceal wide differences in parcel size, access, legal usability and likely resale market.
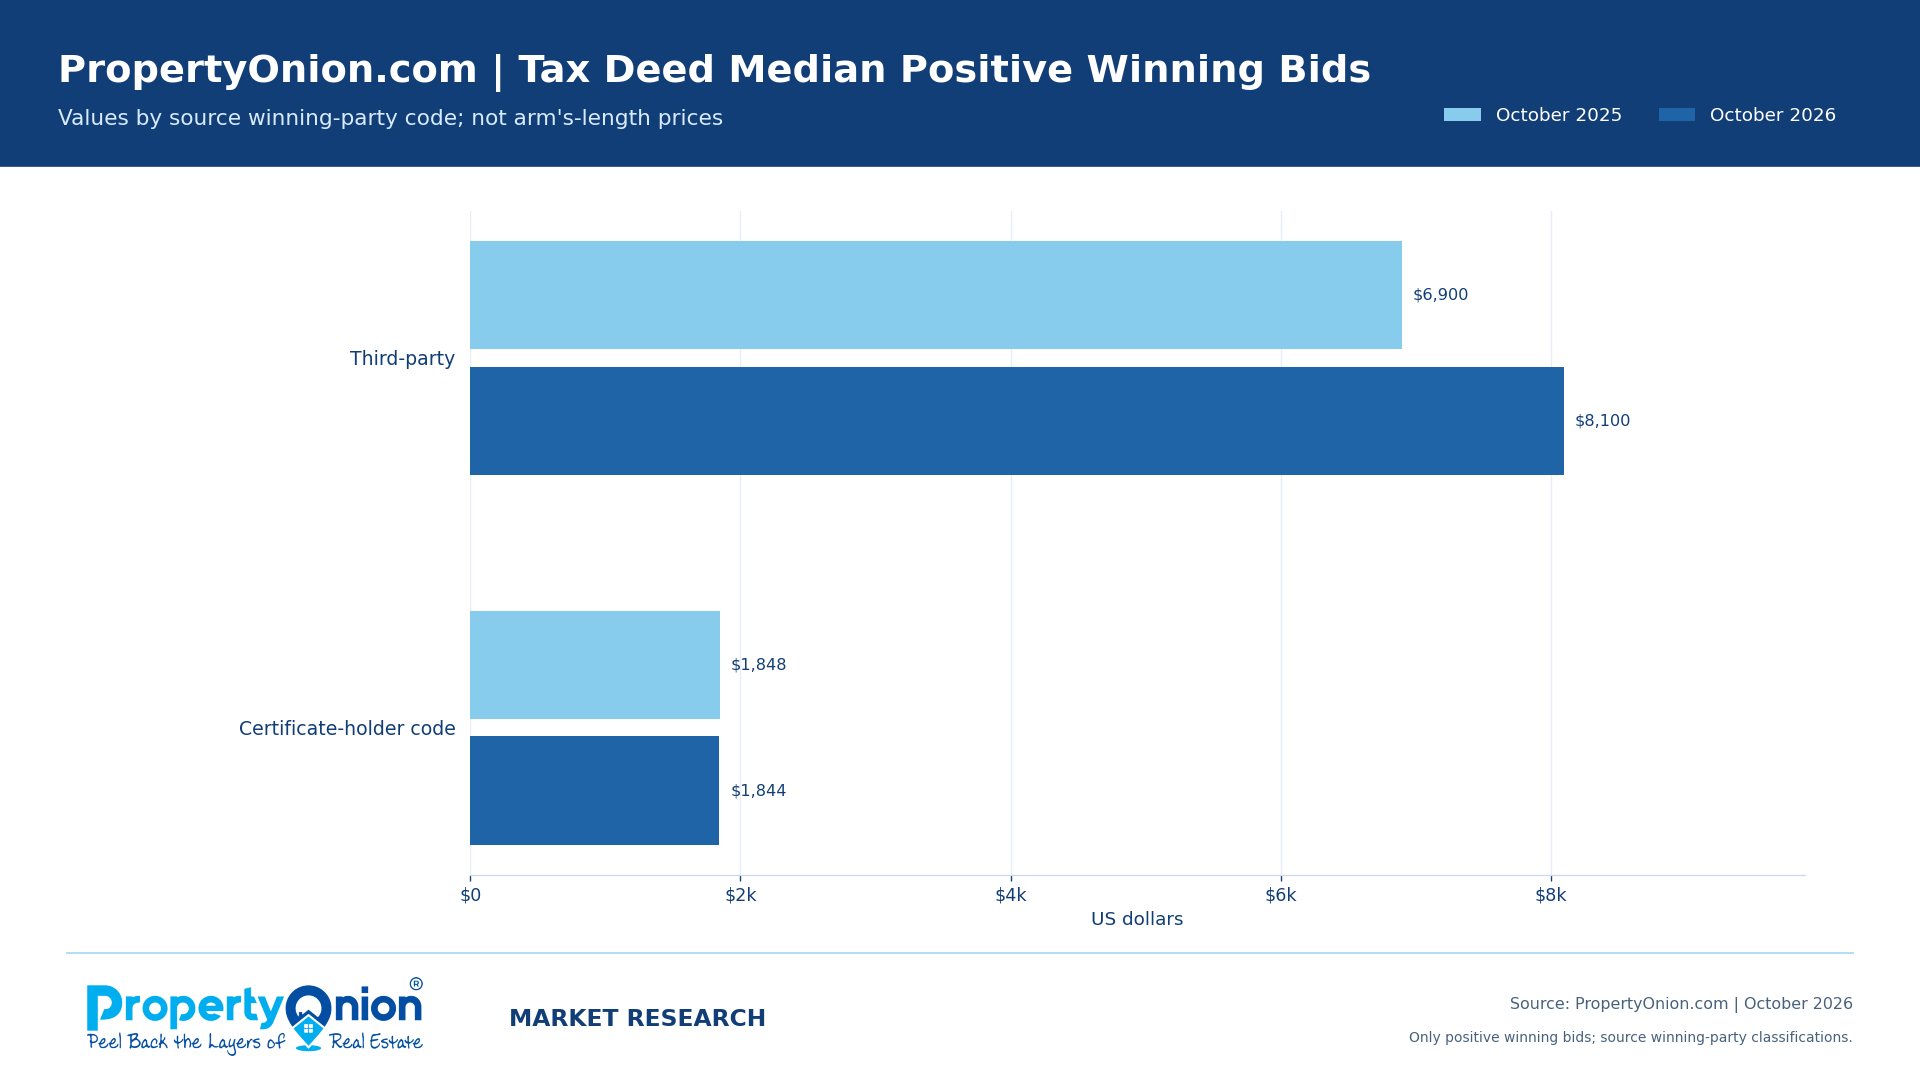
For third-party wins with positive reported bids, the October 2026 median was $8,100 across 609 sales, versus $6,900 across 738 such sales in October 2025. These are auction winning bids, not prices from independently verified market transactions. Non-third-party source-code bids should not be treated as comparable cash purchases.
| Property type | Sales | Positive third-party bids | Median bid |
|---|---|---|---|
| Land | 522 | 456 | $6,150 |
| Single Family | 68 | 66 | $72,700 |
| Mobile | 59 | 58 | $29,500 |
| Agricultural | 9 | 9 | $5,100 |
| Condominium | 7 | 7 | $32,100 |
| Multifamily | 7 | 7 | $13,800 |
What outside bidders paid compared with estimated property values
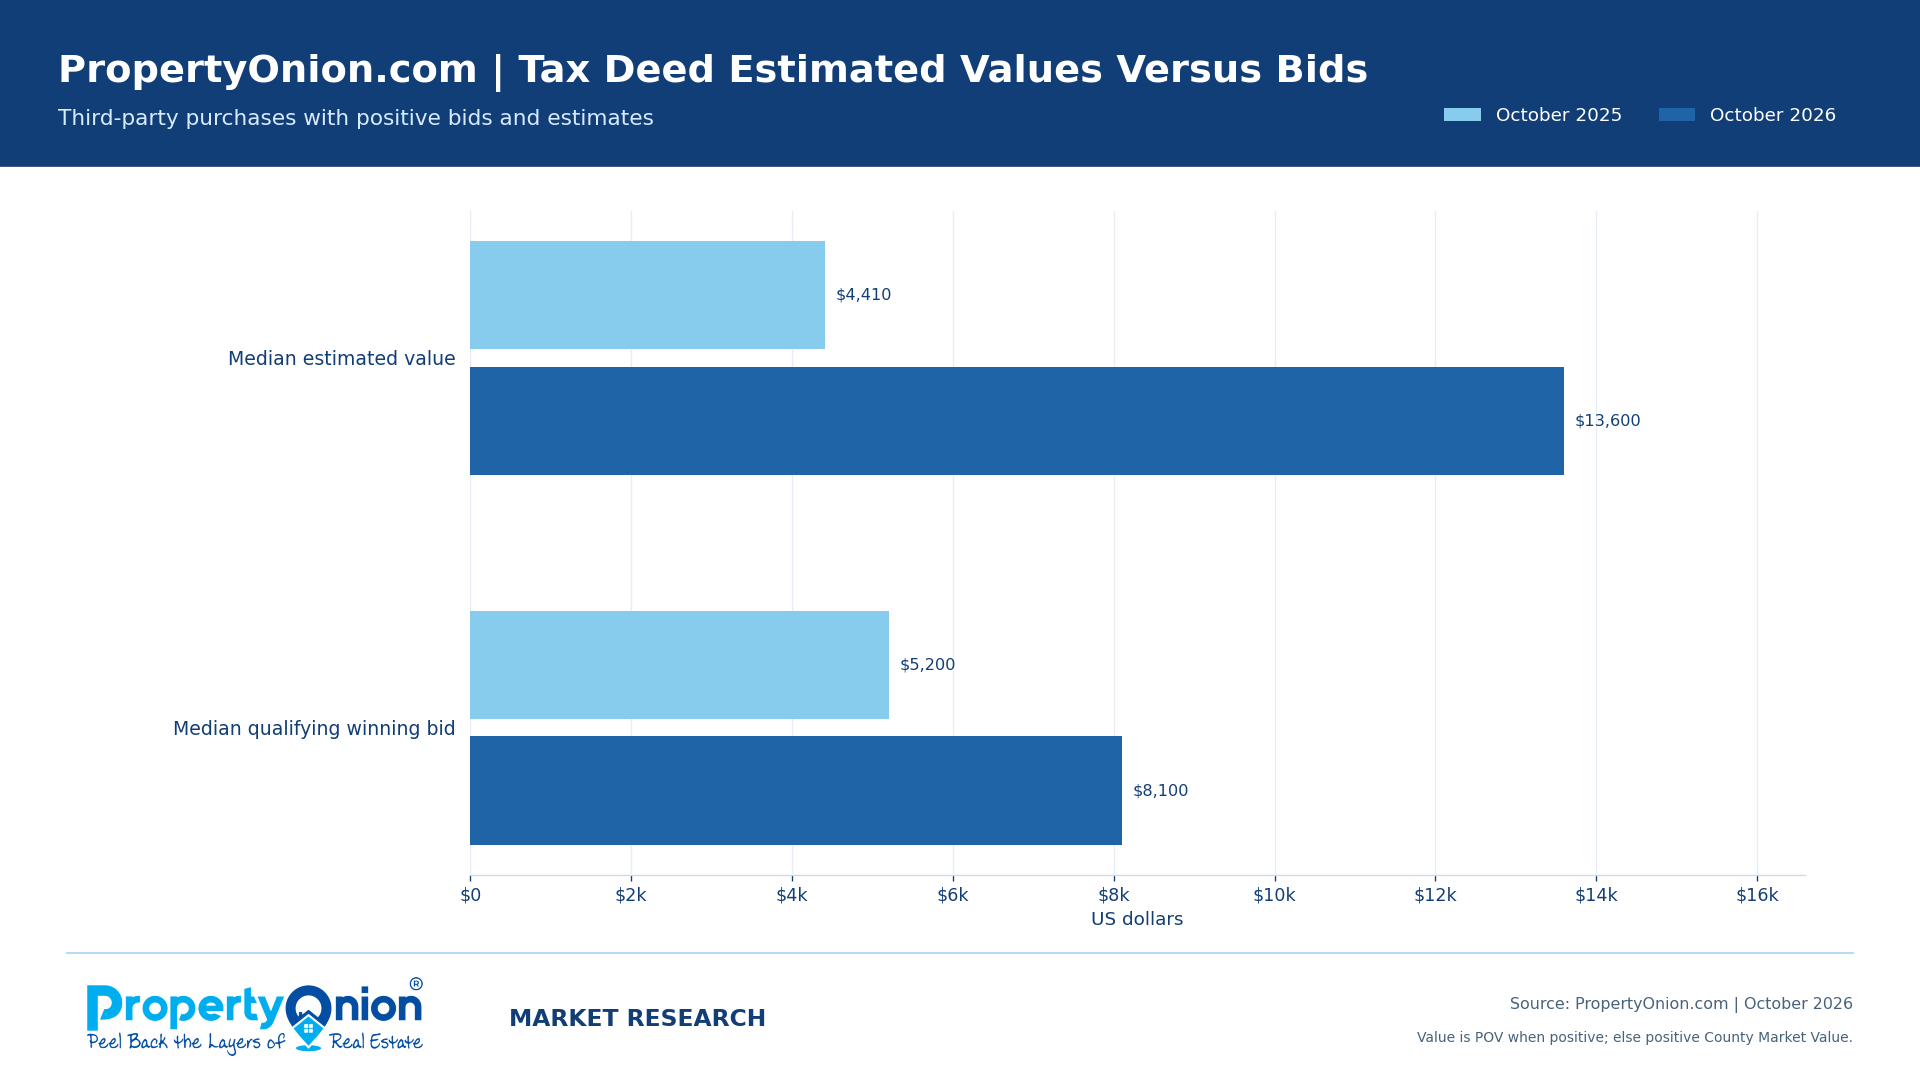
The October 2026 valuation analysis includes 496 qualifying third-party purchases. Positive PropertyOnion Value (POV) was used for 125; positive County Market Value supplied the fallback for 371. Within this sample, the median estimated value was $13,600, while the separately calculated median winning bid was $8,100.
| Third-party valuation metric | Oct. 2025 | Oct. 2026 |
|---|---|---|
| Third-party wins | 738 | 609 |
| Purchases with positive bid and estimate | 448 | 496 |
| Valuation source: POV | 110 | 125 |
| Valuation source: County Market Value | 338 | 371 |
| Median estimated value | $4,410 | $13,600 |
| Median qualifying bid | $5,200 | $8,100 |
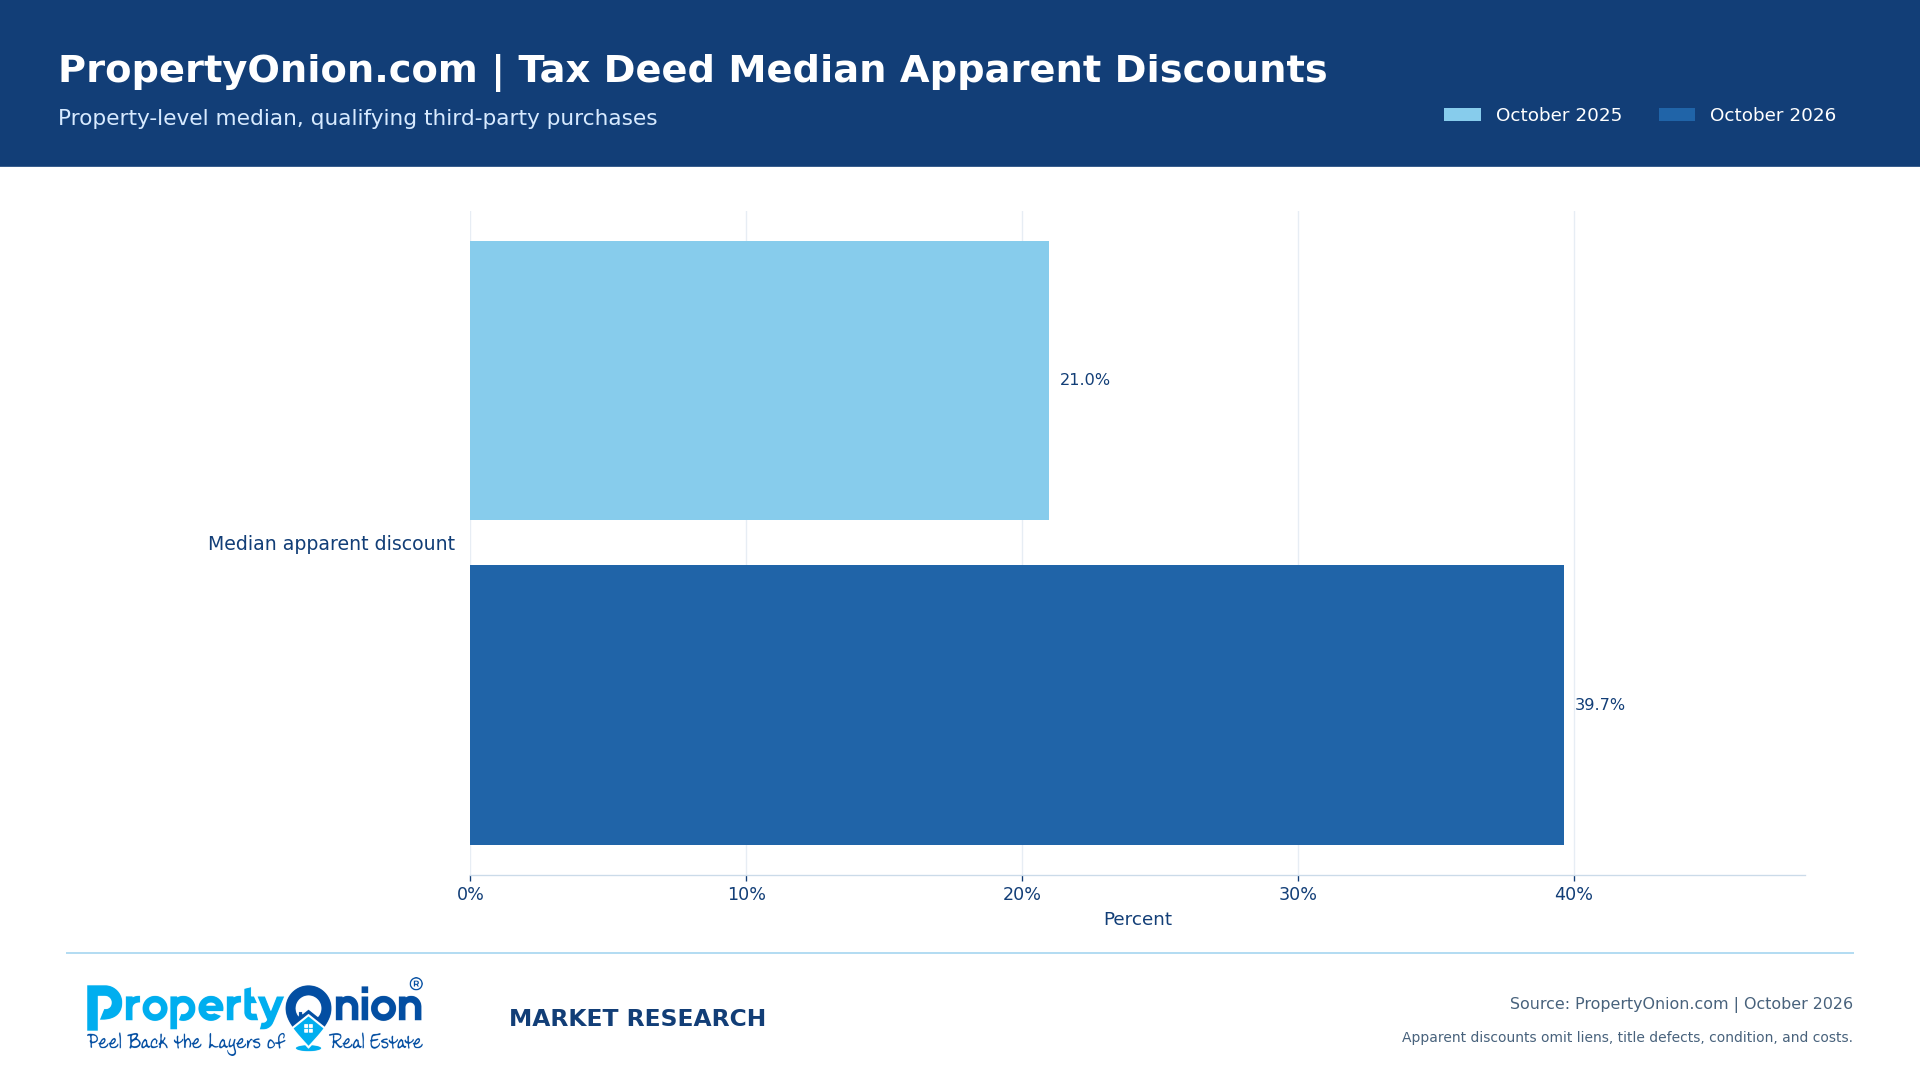
| Median individual-property apparent discount | 21.0% | 39.7% |
| Bids below estimated value | 300 of 448 | 399 of 496 |
The median apparent discount reached 39.7%, not a verified return
For each eligible third-party purchase, PropertyOnion calculates (estimated property value – winning bid) / estimated property value, then takes the median of those individual property-level results. The October 2026 median was 39.7% across 496 purchases, compared with 21.0% for the qualifying 2025 sample. In 2026, 399 bids were below estimated value and 97 were at or above it.
An apparent discount is not guaranteed equity or investment profit. Estimated values do not deduct surviving liens, assessments, title defects, repairs, legal expenses, carrying costs or resale fees. A winning bid below an estimate does not establish the price at which a buyer could actually sell the property.
This distinction is especially important for tax deed land. Parcels can be vacant, inaccessible, undersized or restricted in use, and County Market Value or automated estimates may poorly describe their realizable worth. Before bidding, verify the parcel boundaries, legal access, land-use rules, encumbrances and available title remedies using official records.
Owner redemption was the leading recorded cancellation reason
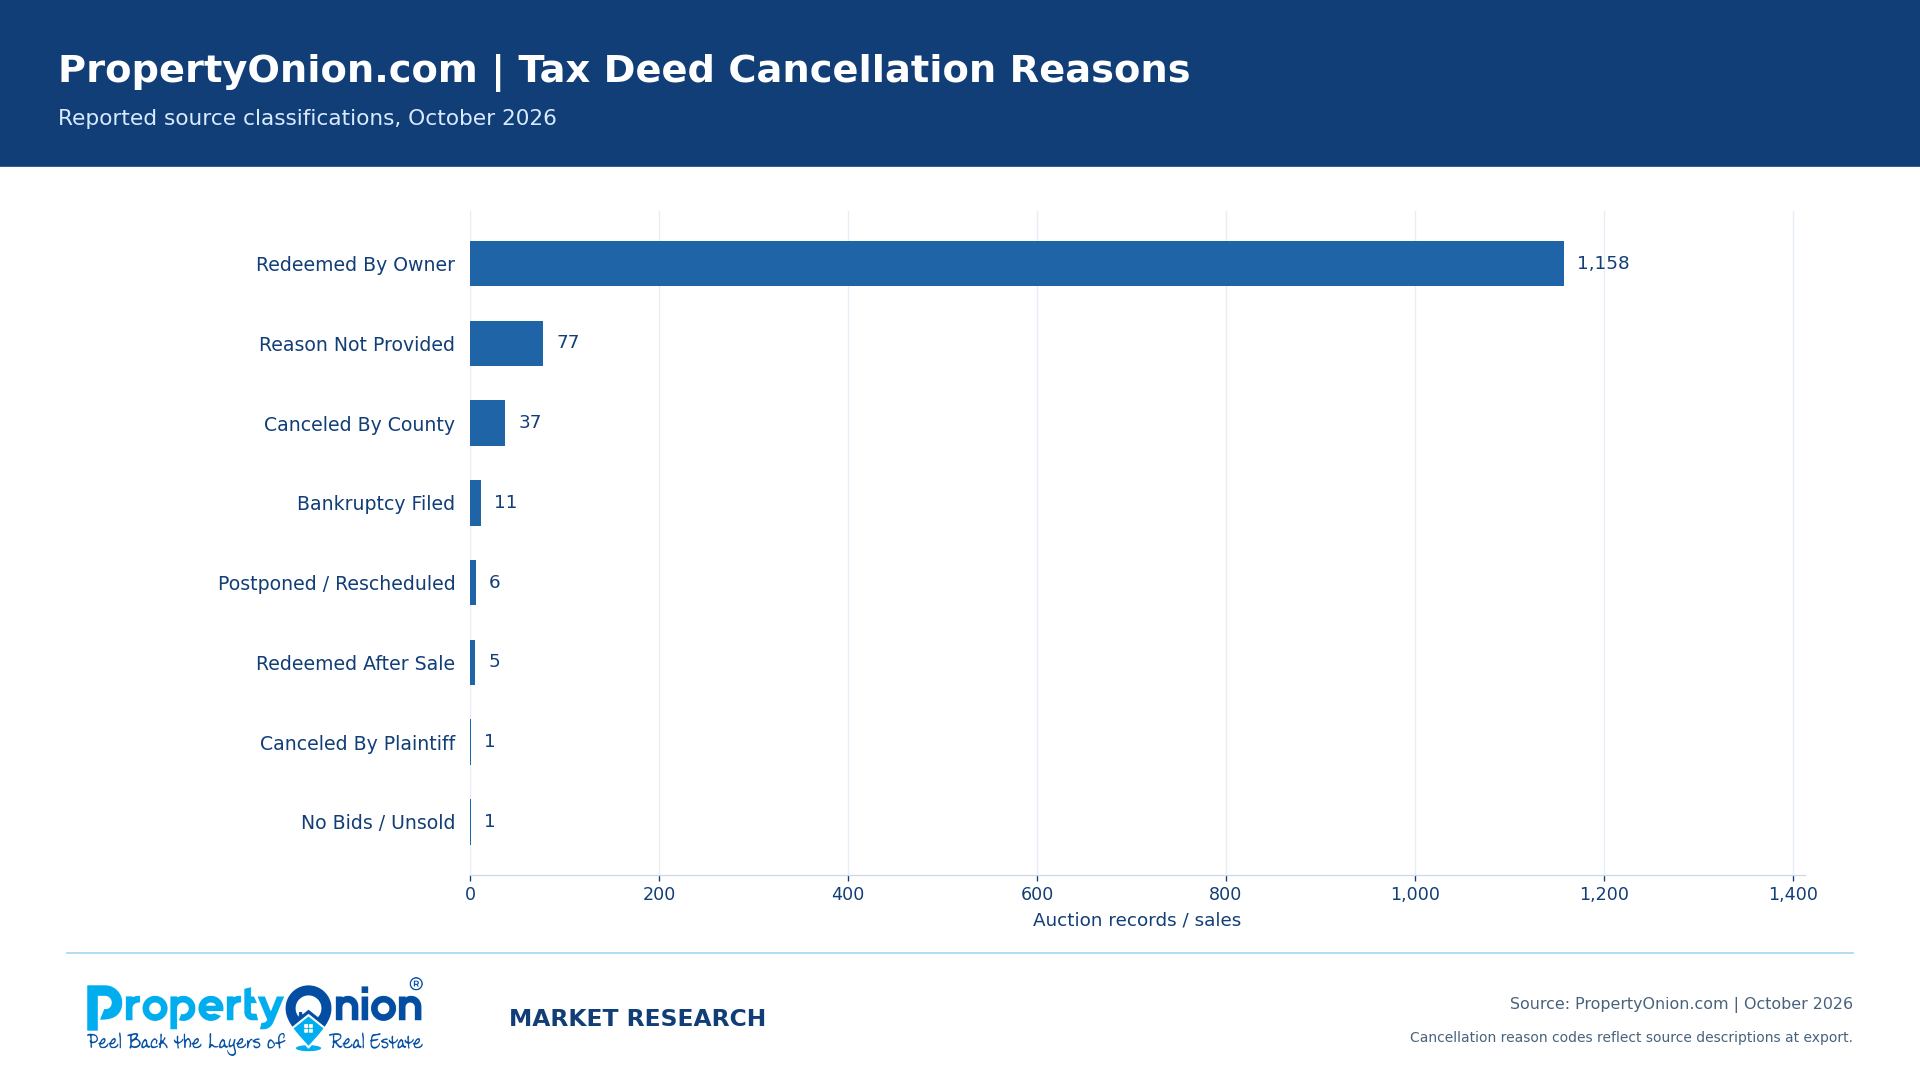
Owner redemptions dominated recorded cancellation reasons. “Redeemed By Owner” appeared on 1,158 of 1,296 October 2026 canceled records (89.4%). These are the original export classifications, not independent legal findings. The October 2025 export has no usable cancellation-reason detail, so the report does not claim that redemptions increased or declined year over year.
| Cancellation classification | October 2026 count |
|---|---|
| Redeemed By Owner | 1,158 |
| Reason Not Provided | 77 |
| Canceled By County | 37 |
| Bankruptcy Filed | 11 |
| Postponed / Rescheduled | 6 |
| Redeemed After Sale | 5 |
| Canceled By Plaintiff | 1 |
| No Bids / Unsold | 1 |
How investors can use the October 2026 tax deed results
Investigate the parcel before the price. Check its legal description, physical and legal access, zoning and buildability, tax and assessment balances, recorded interests, redemption considerations, and the county clerk’s current auction and payment terms. A Sold status in an export does not establish issuance of a deed or marketable title.
Build an all-in budget with conservative allowances for title work, potential obligations, legal fees, carrying costs and a defensible exit value. Use these county outcomes to choose which auctions and parcels merit further investigation, not as a substitute for property-specific due diligence.
Frequently asked questions about October 2026 Florida tax deed auctions
How many Florida tax deed auctions sold in October 2026?
PropertyOnion recorded 681 sold and 1,296 canceled Florida tax deed auction records in the October 2026 export, for 1,977 resolved outcomes. This is an export-based count, not an official total for every Florida auction.
What percentage of tax deed sales went to third-party buyers?
Third-party bidders won 609 of 681 sold auctions (89.4%). Another 66 sales carried the source “Plaintiff” code, and six had unclassified winning parties.
Which county had the most resolved tax deed auctions?
Duval led in resolved records, with 216, including 50 completed sales and 49 third-party wins. Putnam had more completed sales, 105, despite fewer total resolved records.
Does a 39.7% apparent discount mean a profitable purchase?
No. The 39.7% median is a comparison of bids and estimated values on 496 qualifying purchases. It does not verify accessible land, clean title, actual resale value, net equity or returns after costs.
Are these year-over-year results a complete Florida market measure?
No. The October exports differ in reporting dates and represented counties. The matched 36-county comparison gives another view of the data, but cannot establish a complete statewide trend or its cause.
What does the tax deed winner code "Plaintiff" represent?
It is the source winner category applied to 66 October 2026 sold records, interpreted here as certificate-holder-coded for descriptive purposes. The export does not independently confirm certificate ownership, legal title or the ultimate buyer.
Research methodology and limitations
Publisher and source: PropertyOnion.com Market Research, using the supplied October 2025 and October 2026 auction exports. The analysis includes only records with State = FL, Listing Type = Tax Deed, and Auction Status = Sold or Canceled. Each row is an auction record, not necessarily a unique property across multiple scheduled dates.
Reporting periods and geography: October 2025 spans 10-01-2025 through 10-31-2025 and 36 counties. October 2026 spans 10-01-2026 through 10-29-2026 and 43 counties; 36 are common to both exports. The extracts are snapshots with different coverage and may be revised as source records change. They are not official statewide totals.
Winner classifications: “3rd Party” identifies a reported outside purchaser. The source “Plaintiff” code is described as certificate-holder-coded only to summarize this tax deed export, not to confirm any party’s legal status. Unclassified winners remain within sold totals. Tax deed auction sales should not be confused with tax certificate purchases.
Bid and valuation method: Only third-party purchases with positive winning bids and positive estimated values qualify. Use positive PropertyOnion Value (POV) first; otherwise use positive County Market Value. For each eligible purchase, calculate (value – bid) / value, and take the median of those property-level results. The 2026 sample has 496 purchases: 125 using POV and 371 using County Market Value. No liens, repairs, restrictions, title costs or transaction expenses are deducted.
Further limitations: The 2025 cancellation-reason field does not support comparisons by reason. Source property classifications, values and winner codes have not been independently checked against each county; Sold does not confirm a completed deed transfer. County-level comparisons may be affected by record availability, auction timing and subsequent updates.
About PropertyOnion Market Research
PropertyOnion.com publishes original auction research for Florida real estate investors, drawing on its auction export snapshots rather than representing them as certified government totals. Explore the PropertyOnion Market Research archive and the September 2026 Florida Tax Deed Auction Market Report for additional context.
Research appendix: complete October county comparisons
The expandable table preserves the complete October 2025 and 2026 county outcome comparison, including resolved records, 2026 completed sales, third-party wins and comparable year-over-year changes. The percentages describe recorded auctions, not distinct parcels or certified statewide auction volumes.
Show the complete county comparison
Scroll table horizontally to view all columns.
| County | 2025 records | 2026 records | 2026 sold | 2026 third-party | Records change |
|---|---|---|---|---|---|
| Duval | 295 | 216 | 50 | 49 | -26.8% |
| Charlotte | 101 | 143 | 59 | 56 | +41.6% |
| Putnam | 350 | 130 | 105 | 75 | -62.9% |
| Lee | 165 | 121 | 26 | 26 | -26.7% |
| Marion | 59 | 101 | 83 | 83 | +71.2% |
| Highlands | – | 99 | 74 | 63 | – |
| Orange | 69 | 92 | 4 | 4 | +33.3% |
| Hillsborough | 45 | 88 | 8 | 6 | +95.6% |
| Escambia | 80 | 82 | 11 | 11 | +2.5% |
| Volusia | 119 | 74 | 11 | 11 | -37.8% |
| Palm Beach | 55 | 73 | 5 | 3 | +32.7% |
| Brevard | 191 | 65 | 11 | 11 | -66.0% |
| Leon | 28 | 49 | 7 | 7 | +75.0% |
| Citrus | 58 | 40 | 21 | 20 | -31.0% |
| Pasco | 59 | 36 | 17 | 17 | -39.0% |
| Polk | 184 | 36 | 9 | 9 | -80.4% |
| Hernando | 13 | 35 | 14 | 11 | +169.2% |
| St. Lucie | 78 | 34 | 2 | 1 | -56.4% |
| Suwannee | – | 34 | 16 | 13 | – |
| Collier | 37 | 33 | 14 | 14 | -10.8% |
| Bay | 33 | 32 | 13 | 12 | -3.0% |
| Broward | 61 | 31 | 5 | 4 | -49.2% |
| Indian River | 2 | 31 | 9 | 9 | +1450.0% |
| Miami-Dade | 43 | 31 | 3 | 2 | -27.9% |
| Jackson | 11 | 27 | 18 | 18 | +145.5% |
| Manatee | 26 | 27 | 0 | 0 | +3.8% |
| Okeechobee | 33 | 26 | 14 | 8 | -21.2% |
| St. Johns | 31 | 23 | 4 | 0 | -25.8% |
| Martin | – | 22 | 15 | 15 | – |
| Washington | 7 | 21 | 17 | 17 | +200.0% |
| Hendry | 19 | 20 | 12 | 12 | +5.3% |
| Clay | 7 | 18 | 5 | 5 | +157.1% |
| Pinellas | 29 | 17 | 3 | 3 | -41.4% |
| Osceola | 33 | 16 | 2 | 1 | -51.5% |
| Seminole | – | 15 | 1 | 1 | – |
| Santa Rosa | 4 | 13 | 1 | 1 | +225.0% |
| Alachua | 3 | 7 | 5 | 5 | +133.3% |
| Nassau | 1 | 6 | 4 | 3 | +500.0% |
| Walton | – | 6 | 3 | 3 | – |
| Gilchrist | – | 3 | 0 | 0 | – |
| Lake | 31 | 2 | 0 | 0 | -93.5% |
| Flagler | – | 1 | 0 | 0 | – |
| Sarasota | 22 | 1 | 0 | 0 | -95.5% |
Suggested citation: PropertyOnion Market Research, “Florida Tax Deed Auction Market Report: October 2026,” November 2026. Attribute quoted findings to PropertyOnion’s export-based research and retain relevant reporting-period, county-coverage and valuation qualifications.




Comments