PropertyOnion Market Research | October 2026 | Florida foreclosure auctions
Florida foreclosure auction sales increased 33.1% in PropertyOnion’s October 2026 dataset, but third-party investors won a smaller percentage of completed sales. The exports record 1,103 sales in October 2026, up from 829 in October 2025. Outside bidders purchased 403 of those properties, accounting for 36.5% of sales, down from 38.1% a year earlier.
For investors, the distinction is consequential: more completed auctions can mean more properties changing hands without a corresponding increase in the share won by independent buyers. Third-party purchases increased in absolute numbers, yet foreclosing plaintiffs accounted for most sales. Among 396 qualifying outside-bidder purchases, the median apparent discount to estimated property value was 45.0%. That figure does not measure verified equity, resale value or investment profit.
Research scope: PropertyOnion analyzed Florida foreclosure auctions marked Sold or Canceled. The October 2025 export spans 10-01-2025 through 10-31-2025 and represents 40 counties; October 2026 spans 10-01-2026 through 10-30-2026 and represents 43 counties. Both exports share 40 counties. These are source snapshots, not an official census of every Florida foreclosure auction, and their coverage differs.
Three findings that matter to Florida foreclosure investors
1. Sales rose faster than third-party purchases
Completed sales climbed 33.1%, from 829 to 1,103, while third-party wins rose 27.5%, from 316 to 403. Outside bidders’ share fell 1.6 percentage points, from 38.1% to 36.5%. Higher sales volume therefore did not translate into a higher proportion of sales captured by outside investors.
2. County volume and outside-bidder success tell different stories
Broward led October 2026 with 231 resolved records, including 94 sales and 41 third-party purchases. Miami-Dade had 170 resolved records and 74 sales, but outside bidders won 38 of those 74 sales (51.4%). The count of resolved auctions and the percentage acquired by third parties answer different investor questions.
3. Estimated valuation discounts require property-level due diligence
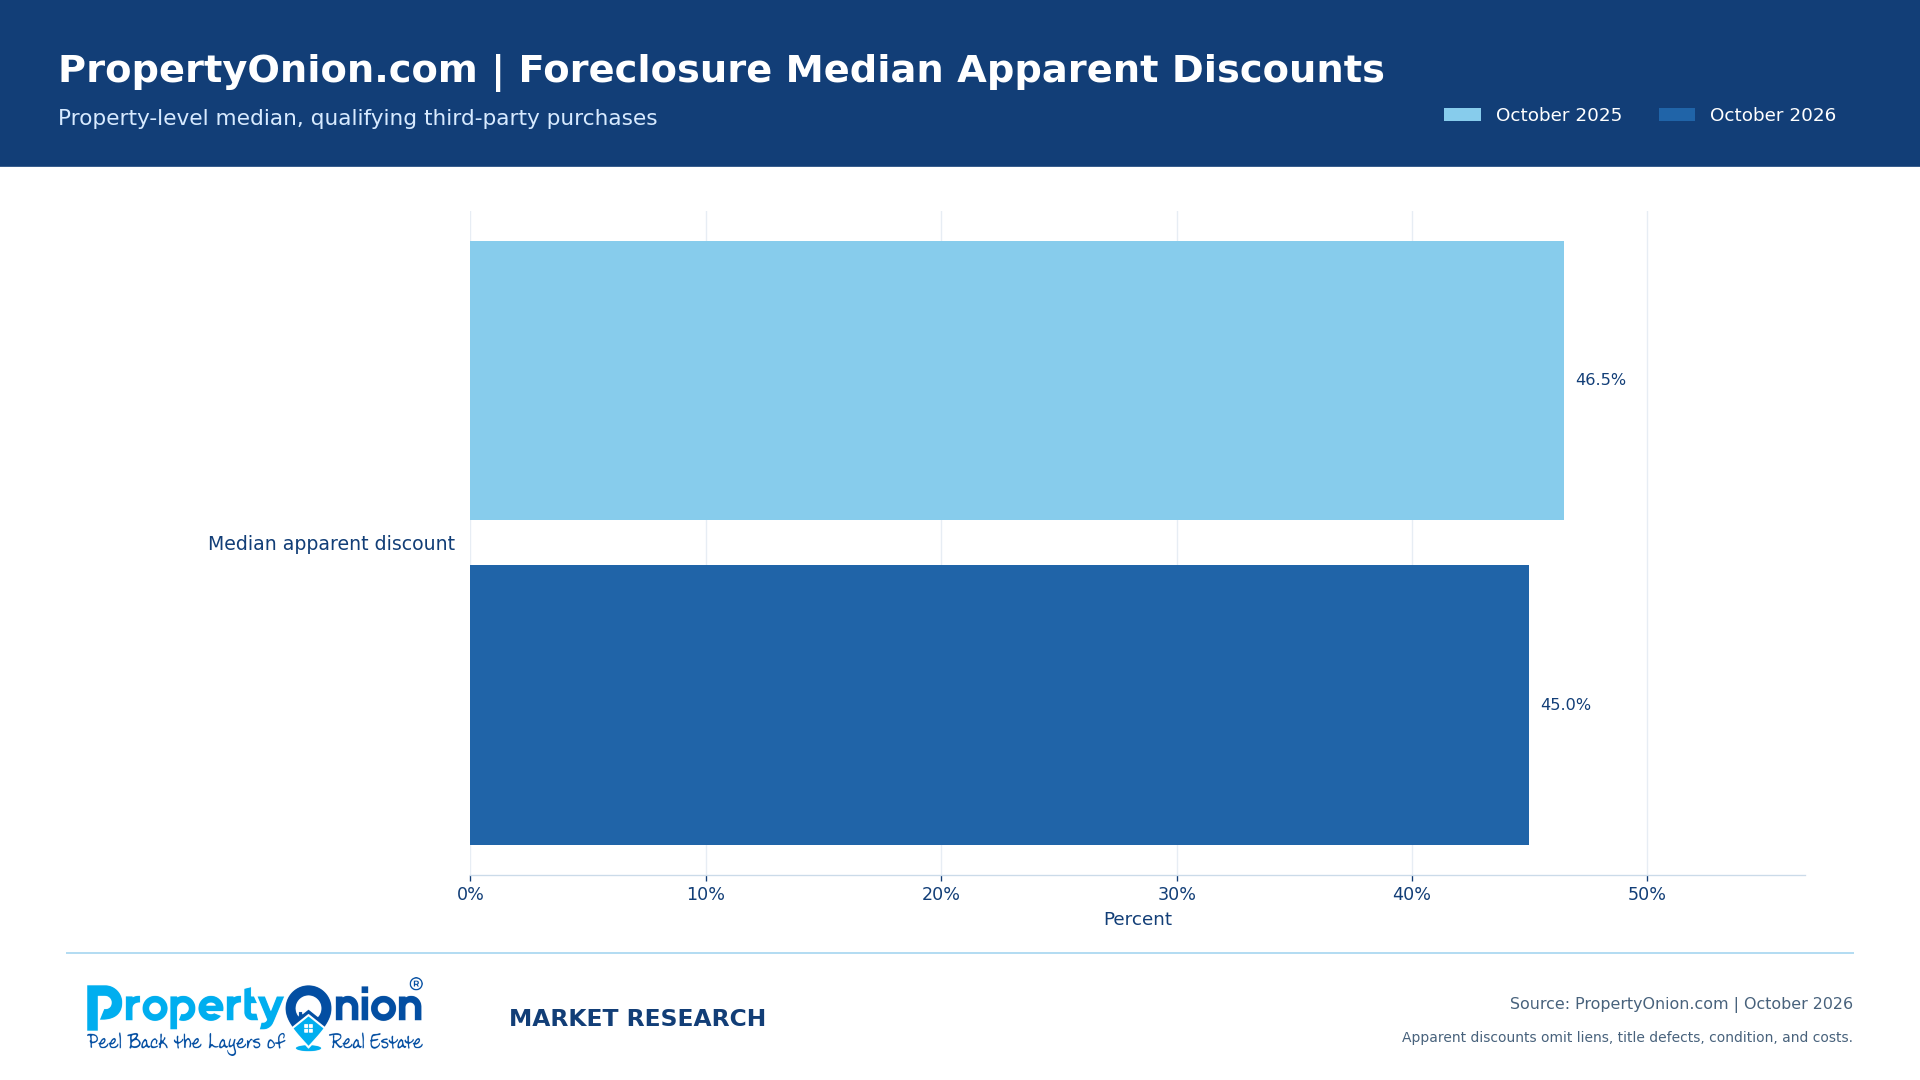
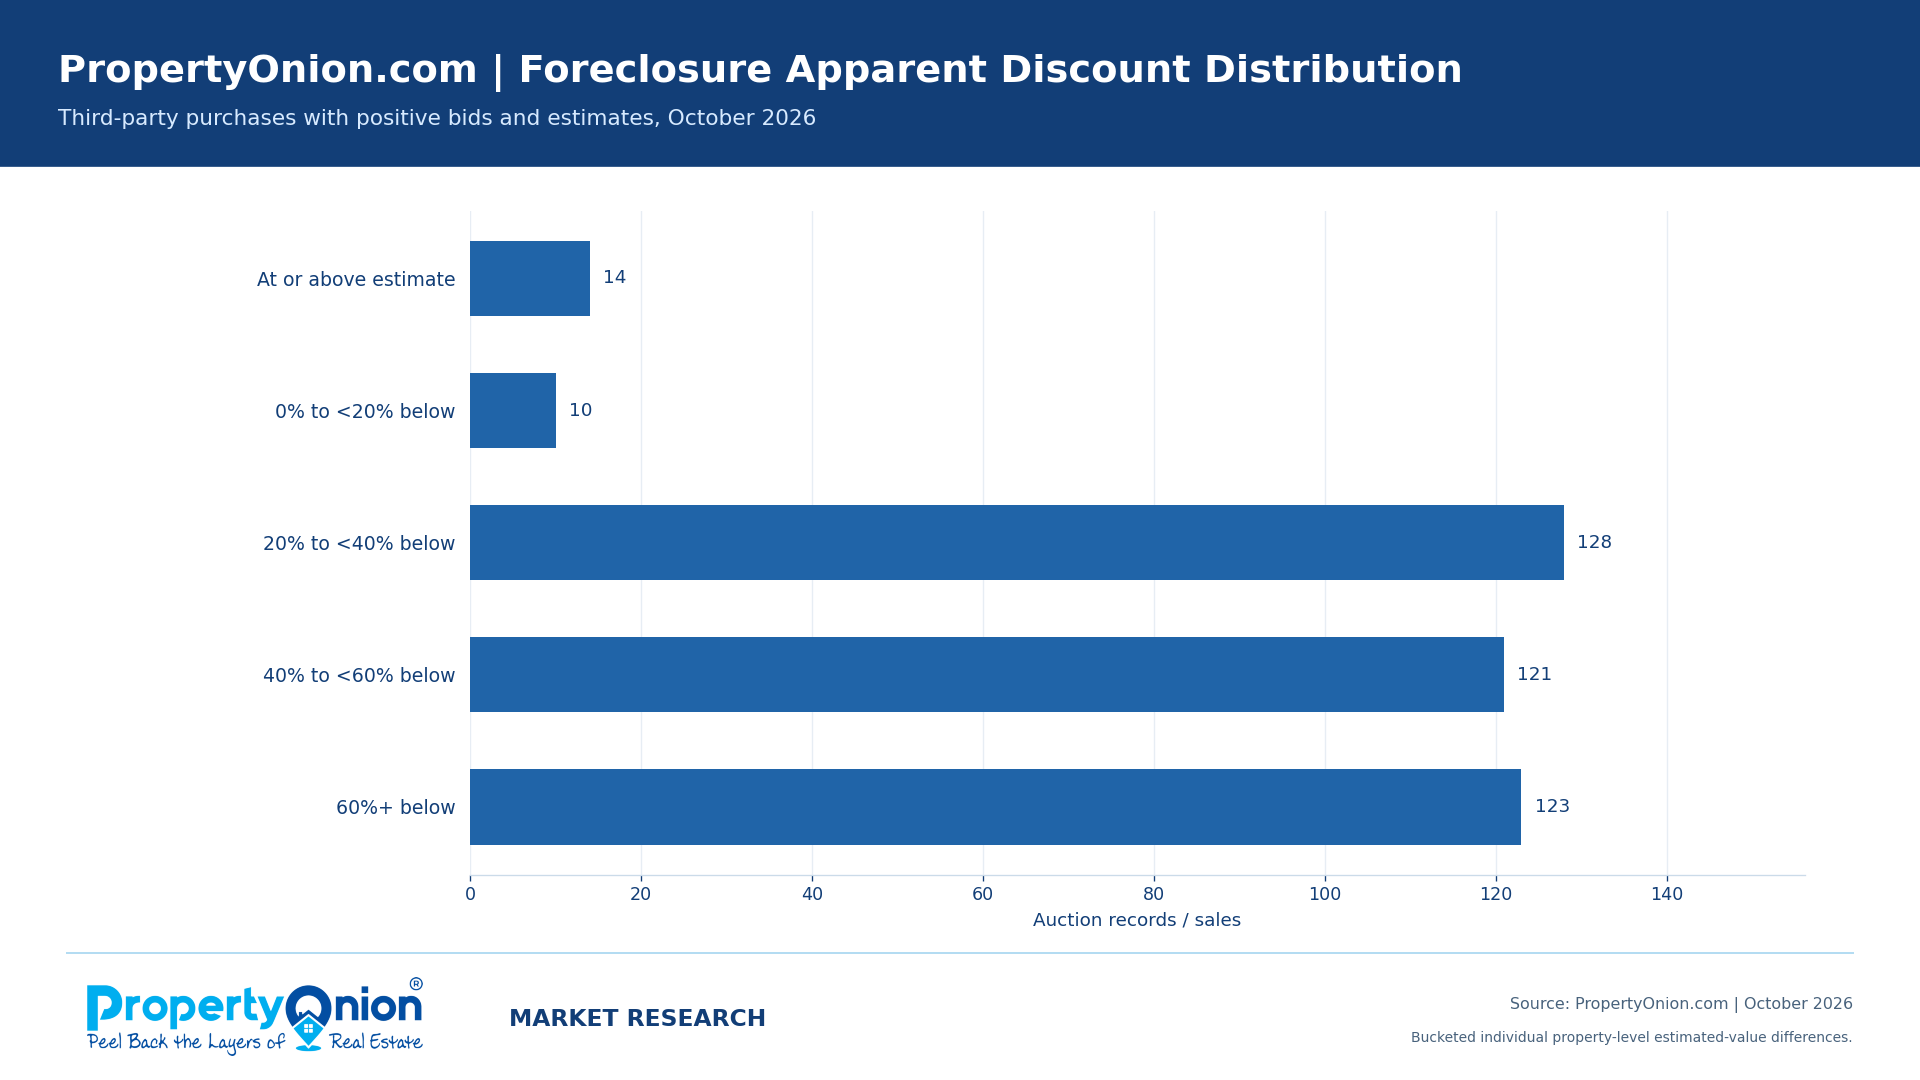
The median apparent discount was 45.0% across 396 third-party October 2026 purchases with positive bids and estimated values. Of those, 382 bids were below the selected value estimate. The calculation is useful for screening individual auctions, but it does not account for liens, title issues, property condition or acquisition expenses.
October 2026 foreclosure research at a glance
PropertyOnion.com export snapshots; not a complete statewide census. Valuation comparisons exclude significant acquisition risks.
October foreclosure sales increased, while cancellations rose modestly
PropertyOnion recorded 2,173 resolved foreclosure outcomes in October 2026, versus 1,859 in October 2025, a 16.9% increase in the reported records. Sales increased 33.1% and cancellations increased 3.9%. Because the extracts cover different county sets and the 2026 period ends on October 30, these changes describe the exports rather than a controlled statewide trend.
| Metric | Oct. 2025 | Oct. 2026 | Change |
|---|---|---|---|
| Resolved records | 1,859 | 2,173 | +16.9% |
| Sold | 829 | 1,103 | +33.1% |
| Canceled | 1,030 | 1,070 | +3.9% |
| Third-party wins | 316 | 403 | +27.5% |
| Third-party share of sales | 38.1% | 36.5% | -1.6 percentage points |
| Median apparent discount, qualifying purchases | 46.5% | 45.0% | -1.5 percentage points |
A same-county check supports the sales increase
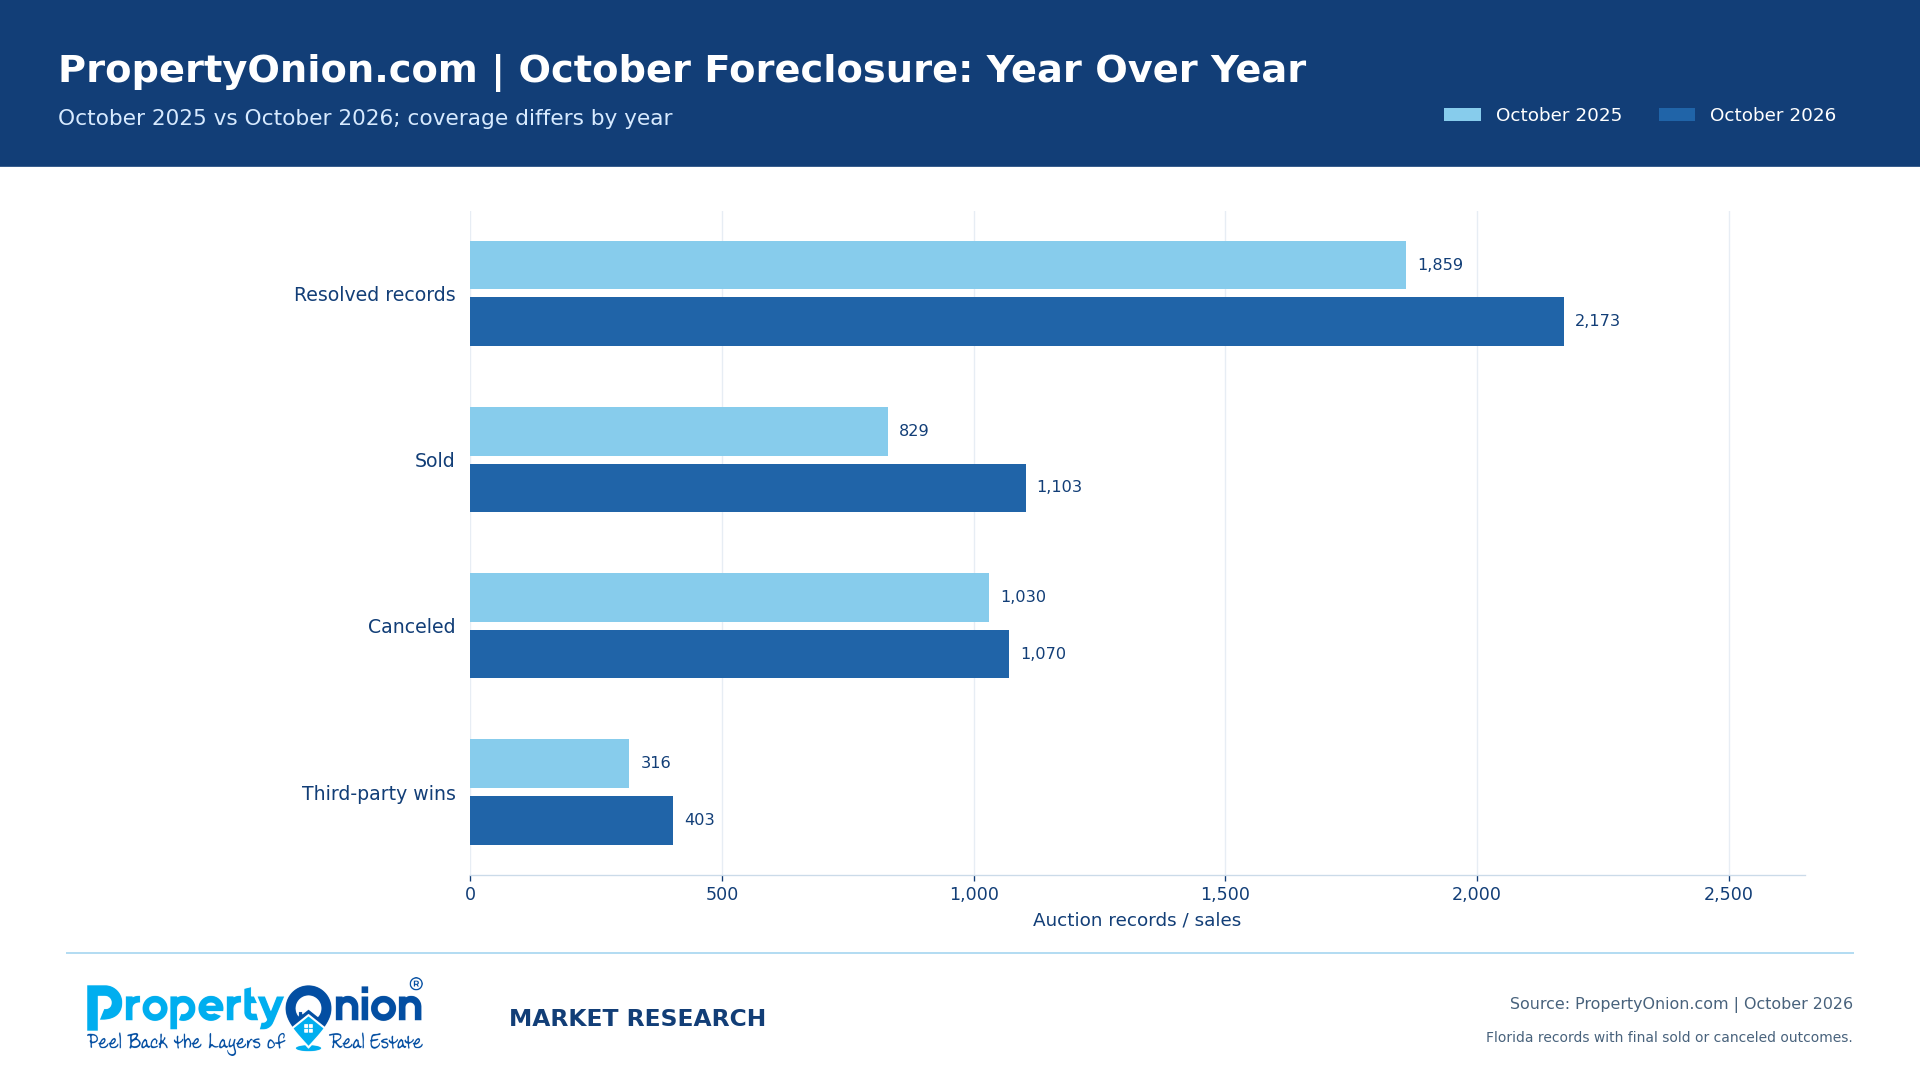
Within the 40 counties represented in both October exports, completed foreclosure sales rose from 829 in 2025 to 1,092 in 2026 (31.7%). Third-party wins increased from 316 to 396 (25.3%). Holding the county set constant supports the direction of the reported increase, although it cannot establish identical data completeness within each county or explain the change.
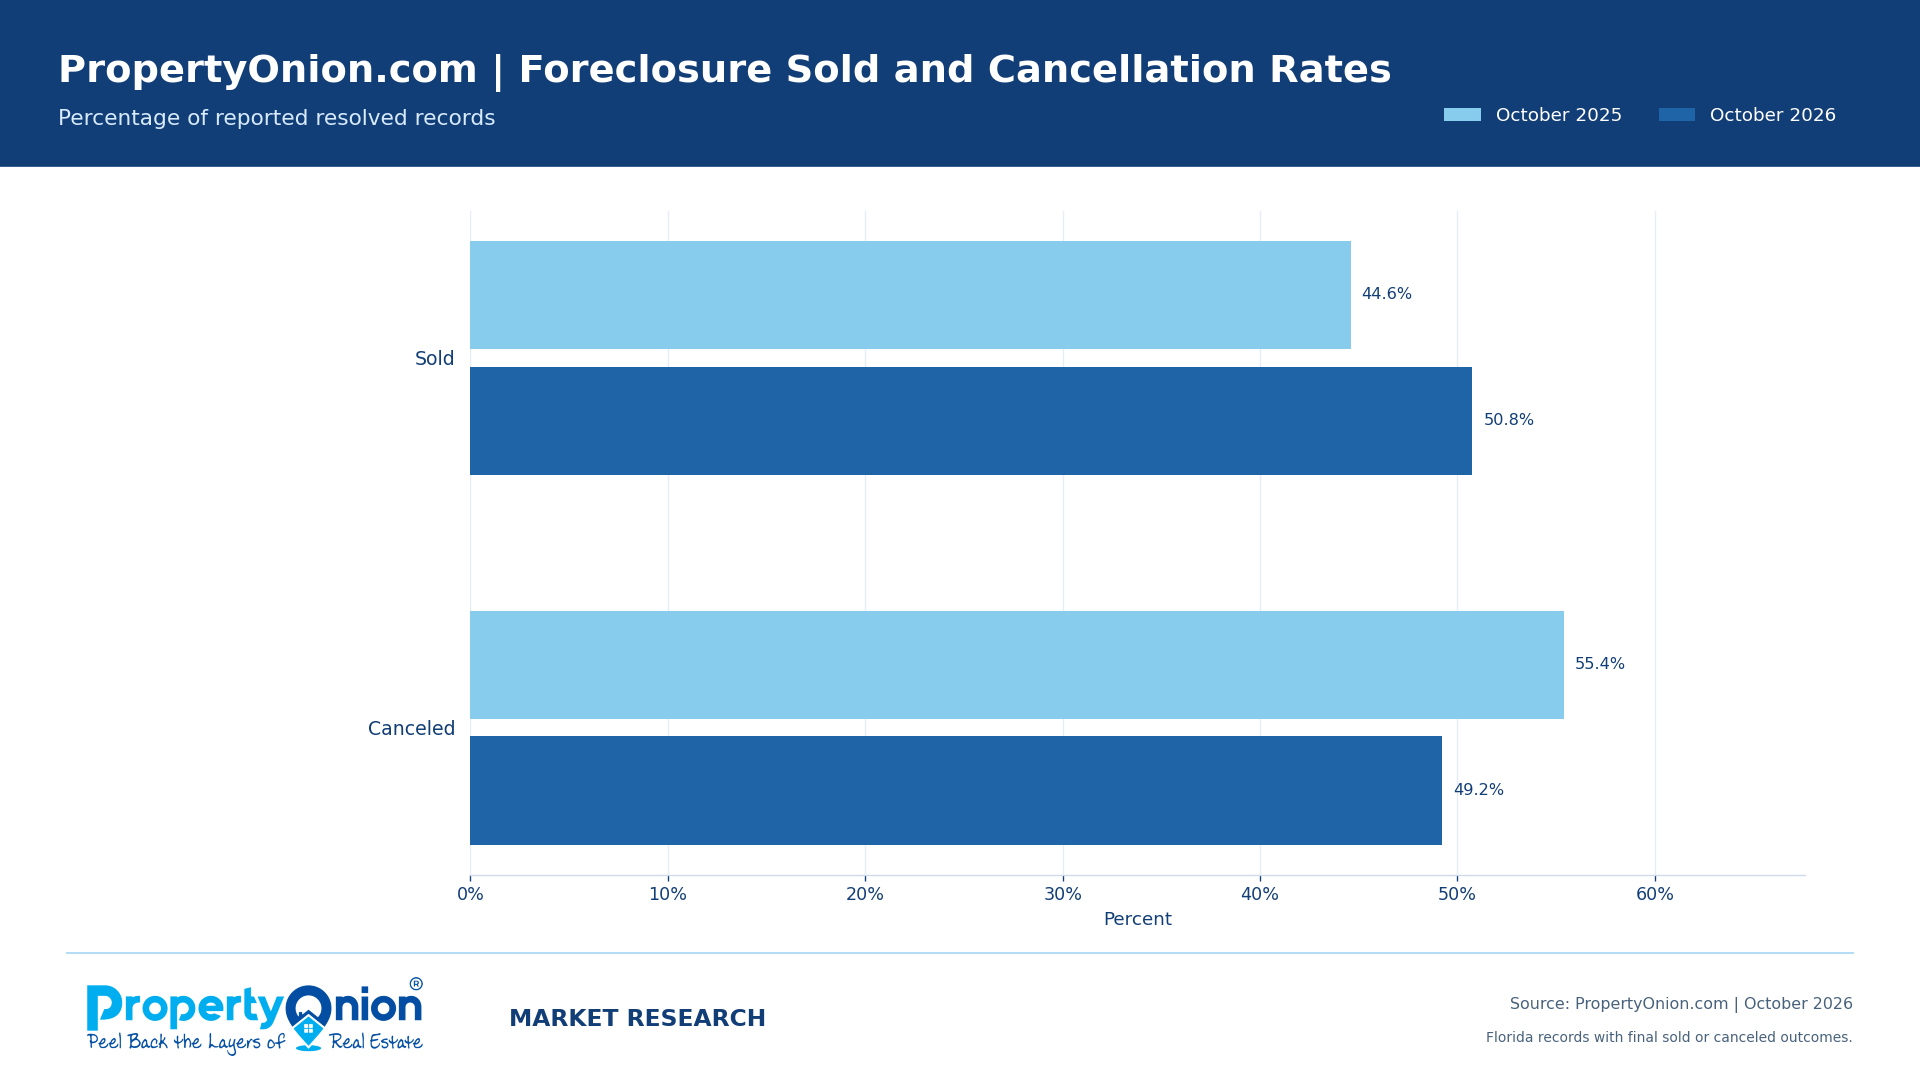
Just over half of resolved October 2026 foreclosure auctions sold
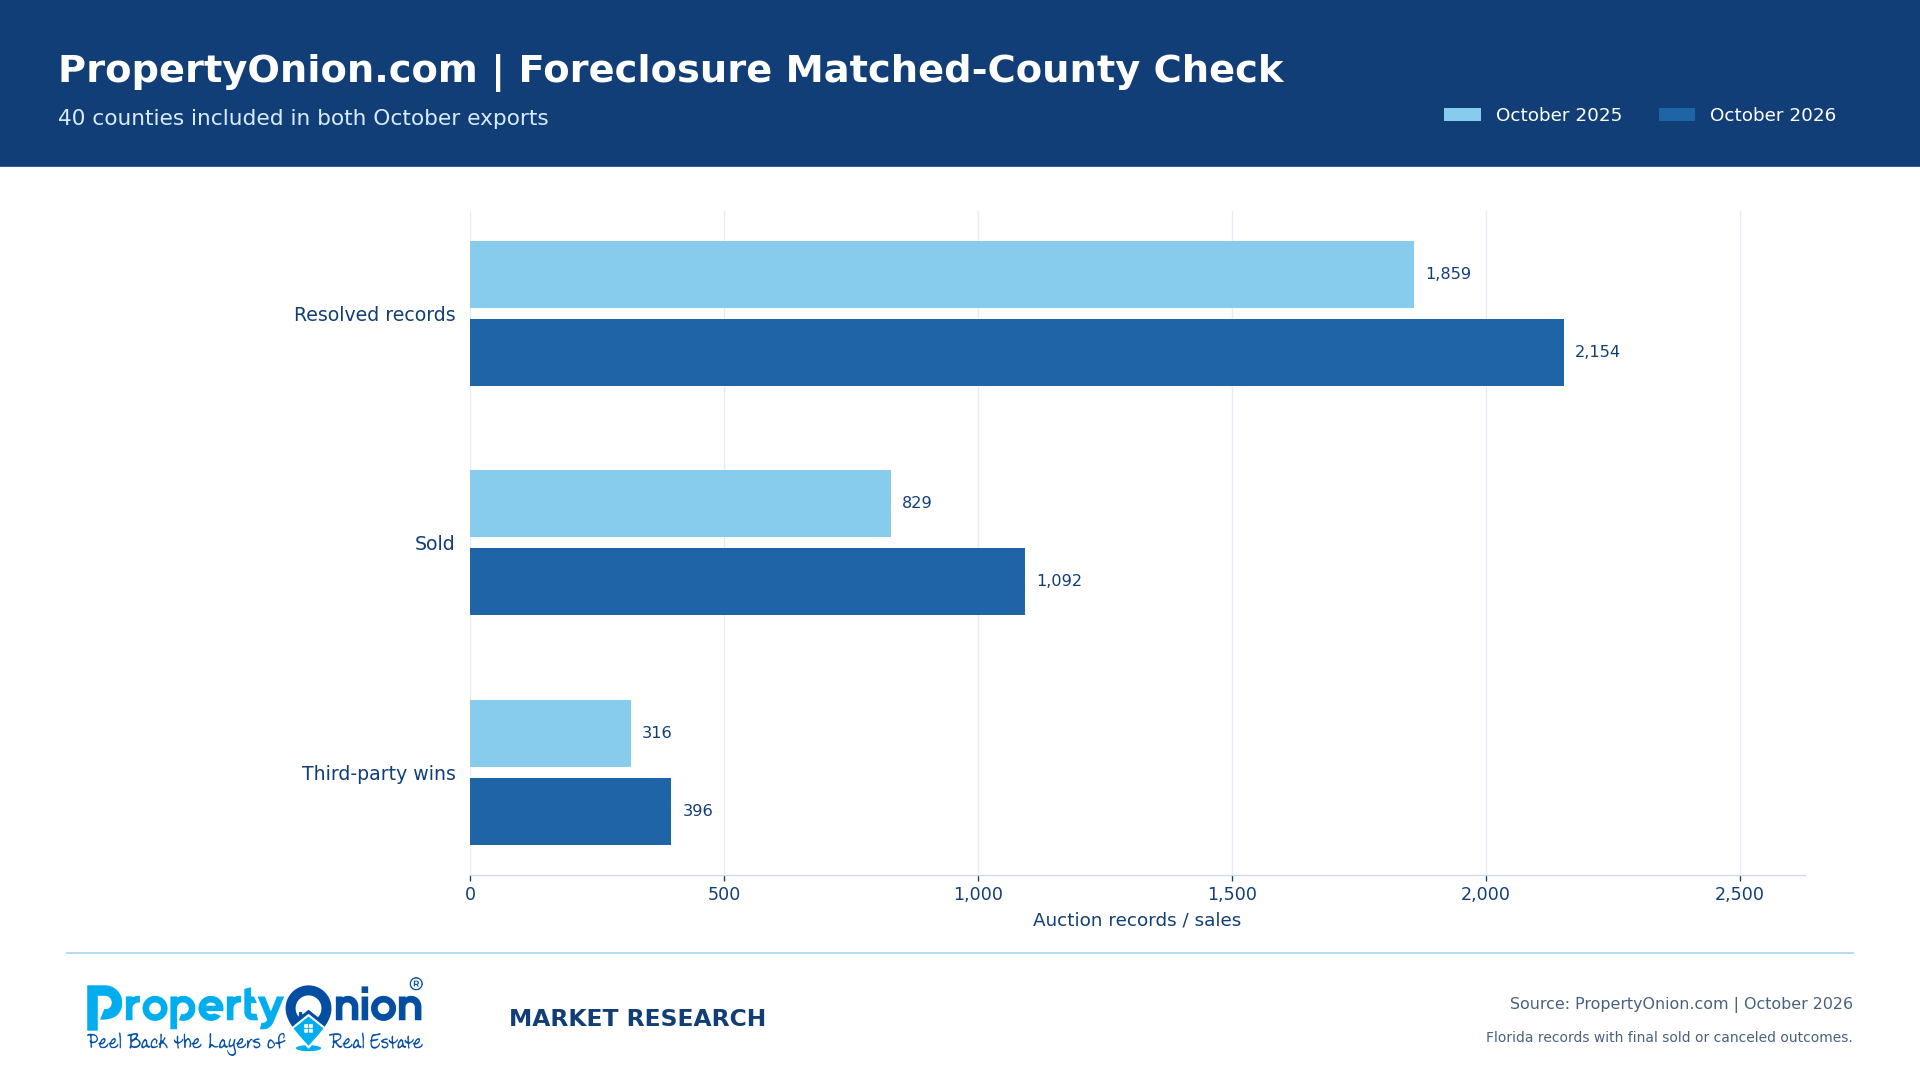
Slightly more than half of October 2026 resolved foreclosure records resulted in a completed sale. That is a higher sold share than in October 2025, even though cancellations remained common. A canceled auction did not produce a completed purchase in this dataset and may be rescheduled or resolved later.
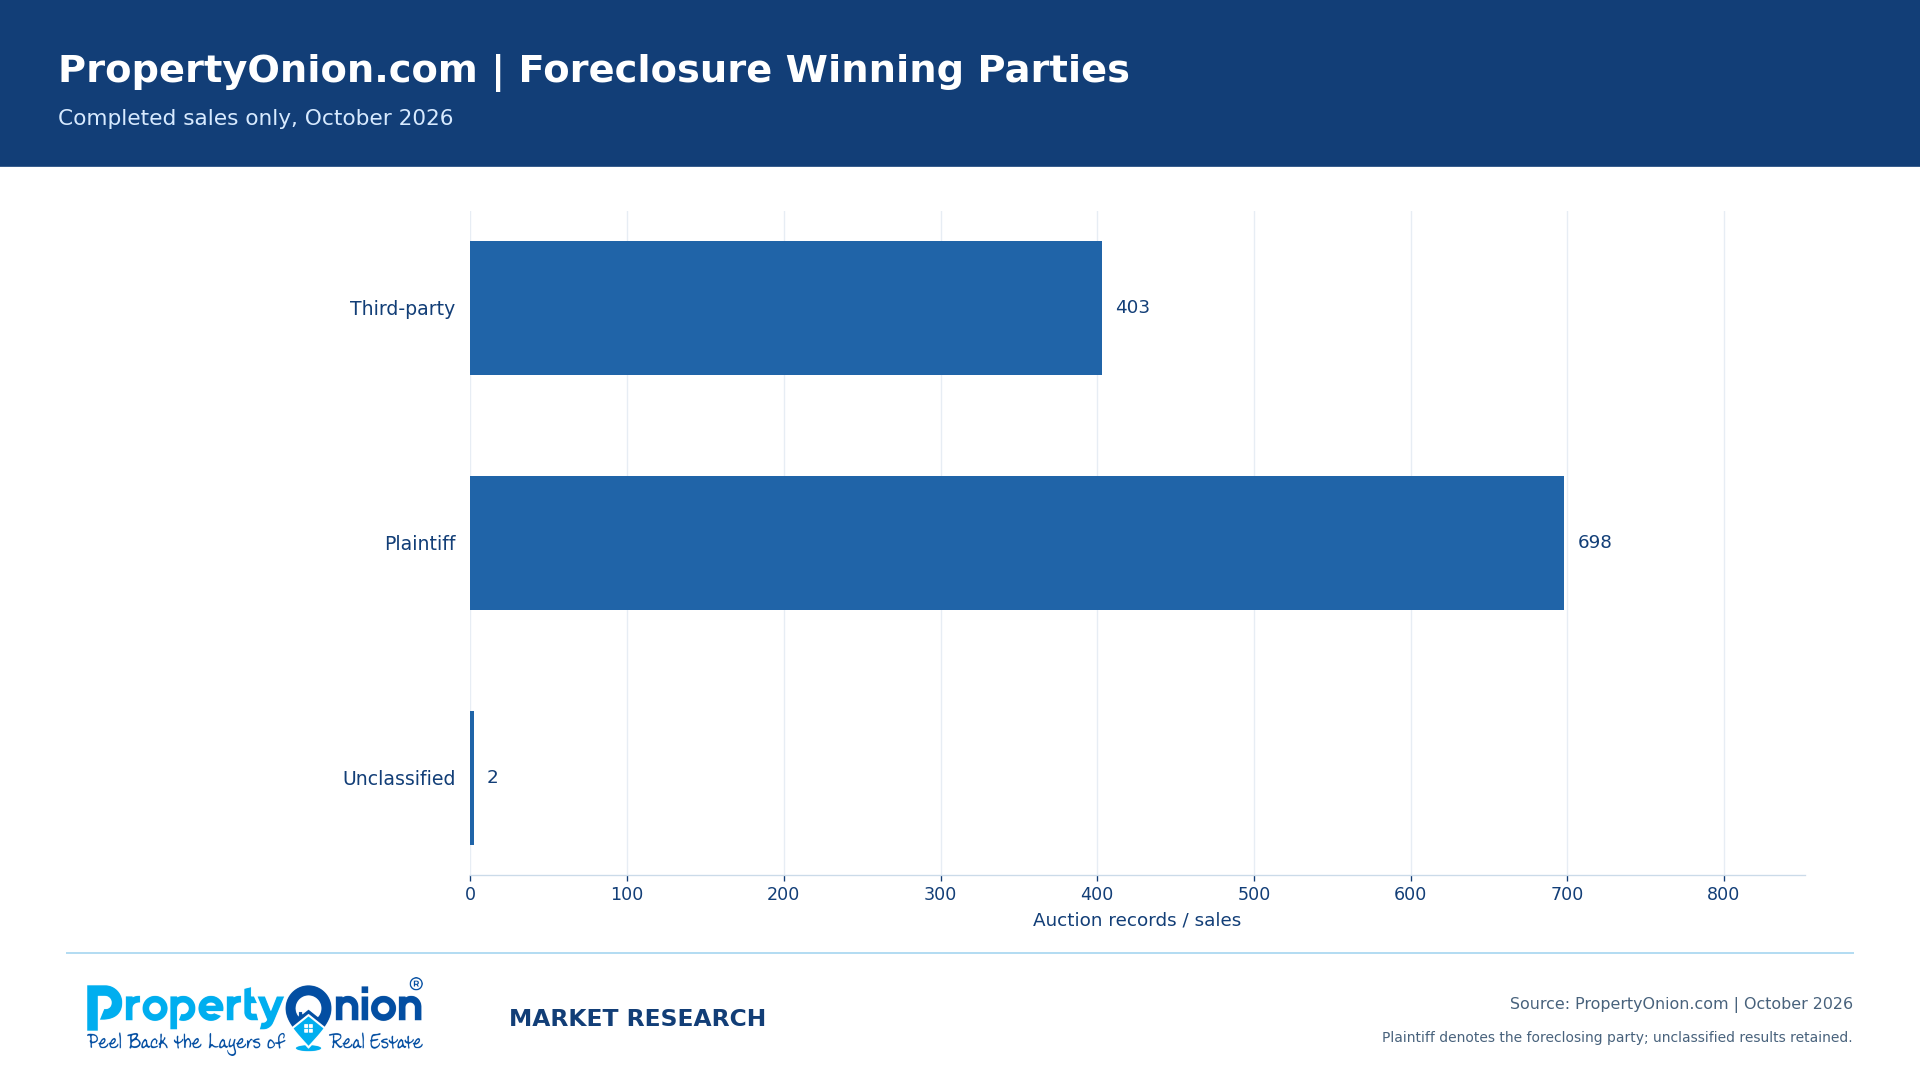
Who acquired the properties: third parties or foreclosing plaintiffs?
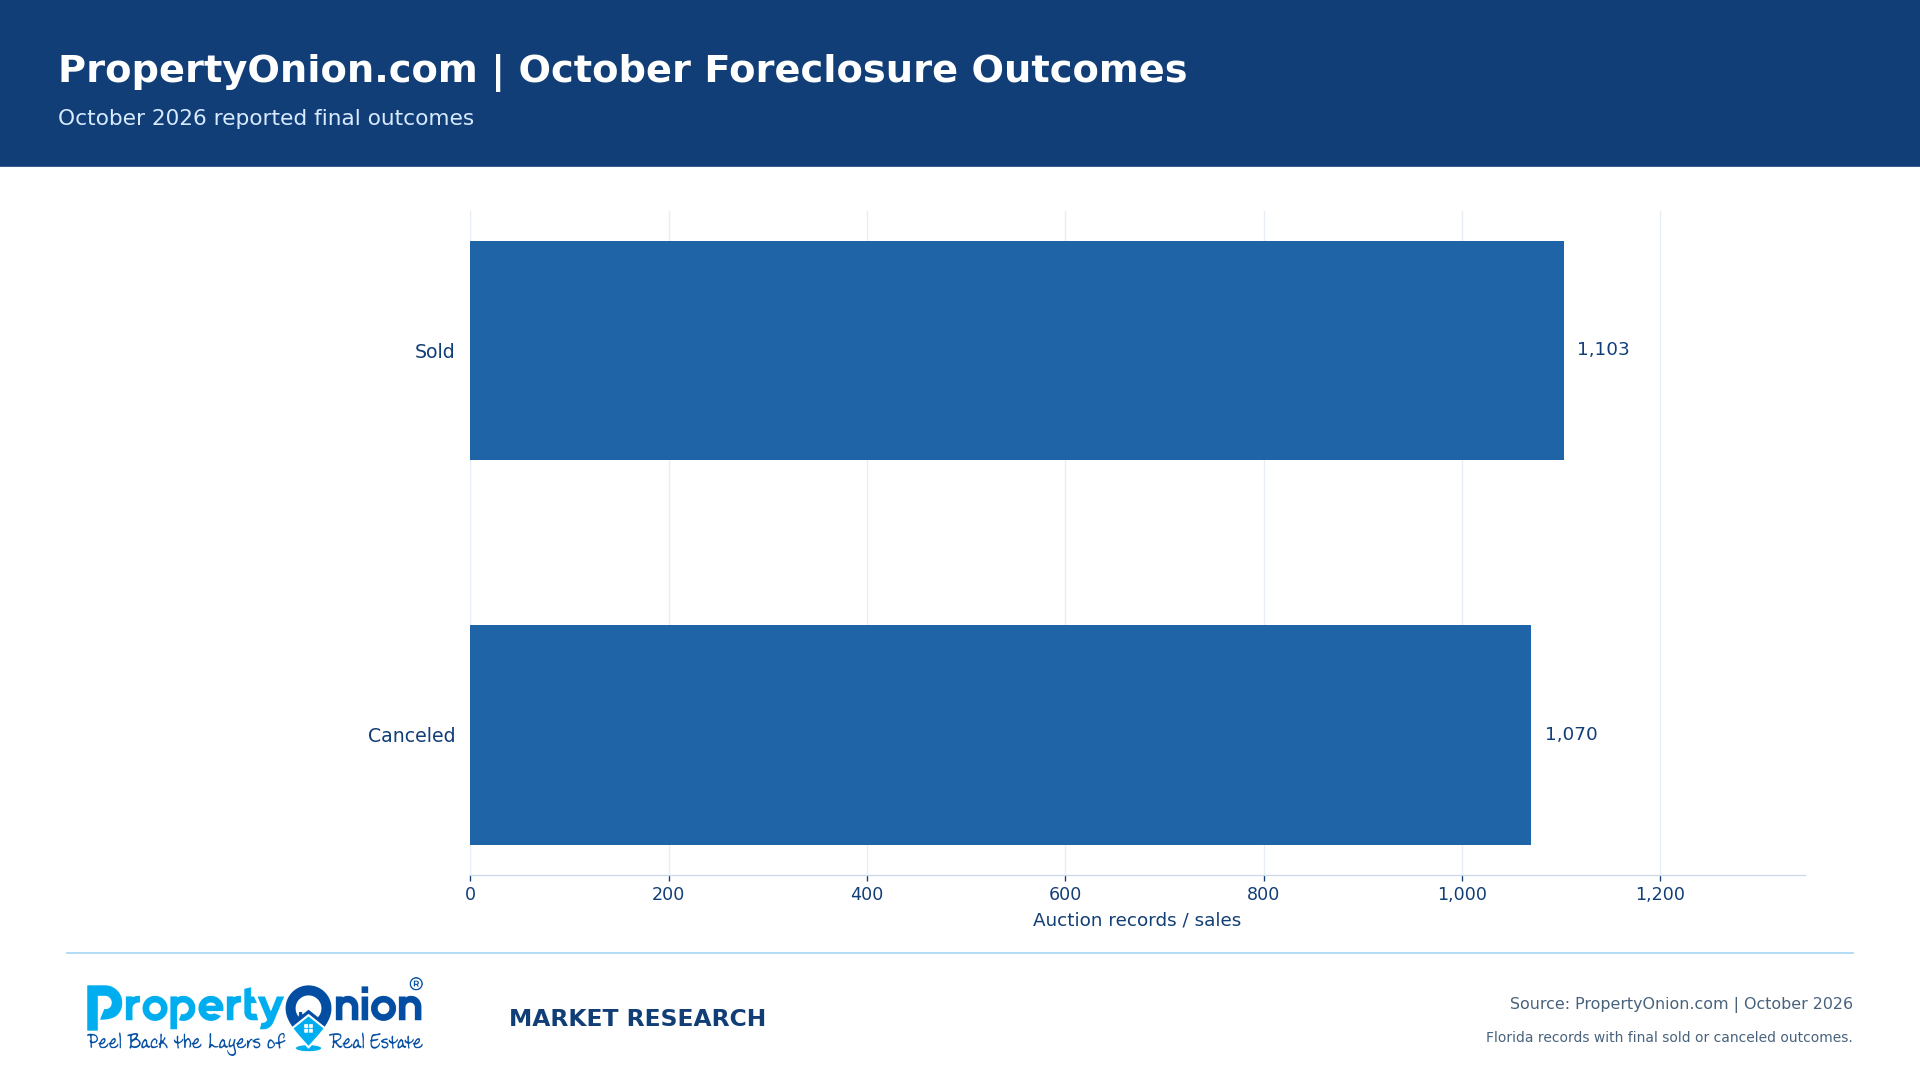
Third-party purchasers won 403 of 1,103 October 2026 foreclosure sales (36.5%). Foreclosing plaintiffs won 698 (63.3%), and two sold records had no usable winner classification. For comparison, the October 2025 export recorded 316 third-party wins, 512 plaintiff wins and one unclassified sale among 829 sales.
A plaintiff win can involve a credit bid against an existing debt rather than a cash purchase at an arm’s-length price. That is why PropertyOnion reports plaintiff and third-party outcomes separately, and calculates apparent valuation discounts only for qualifying third-party purchases.
County comparison: where auction volume differs from investor participation
The following ten counties had the highest numbers of resolved foreclosure records in October 2026, including both sold and canceled outcomes. The third-party winning percentage uses completed sales as its denominator. Comparing all three measures helps distinguish an active auction docket from actual outside-bidder acquisitions.
Scroll table horizontally to view all columns.
| County | Resolved | Sold | Third-party wins | Third-party share |
|---|---|---|---|---|
| Broward | 231 | 94 | 41 | 43.6% |
| Miami-Dade | 170 | 74 | 38 | 51.4% |
| Hillsborough | 166 | 78 | 35 | 44.9% |
| Lee | 132 | 83 | 29 | 34.9% |
| Palm Beach | 131 | 44 | 21 | 47.7% |
| Orange | 129 | 42 | 21 | 50.0% |
| Duval | 128 | 65 | 24 | 36.9% |
| Polk | 123 | 67 | 30 | 44.8% |
| Brevard | 86 | 52 | 16 | 30.8% |
| Pinellas | 86 | 53 | 16 | 30.2% |
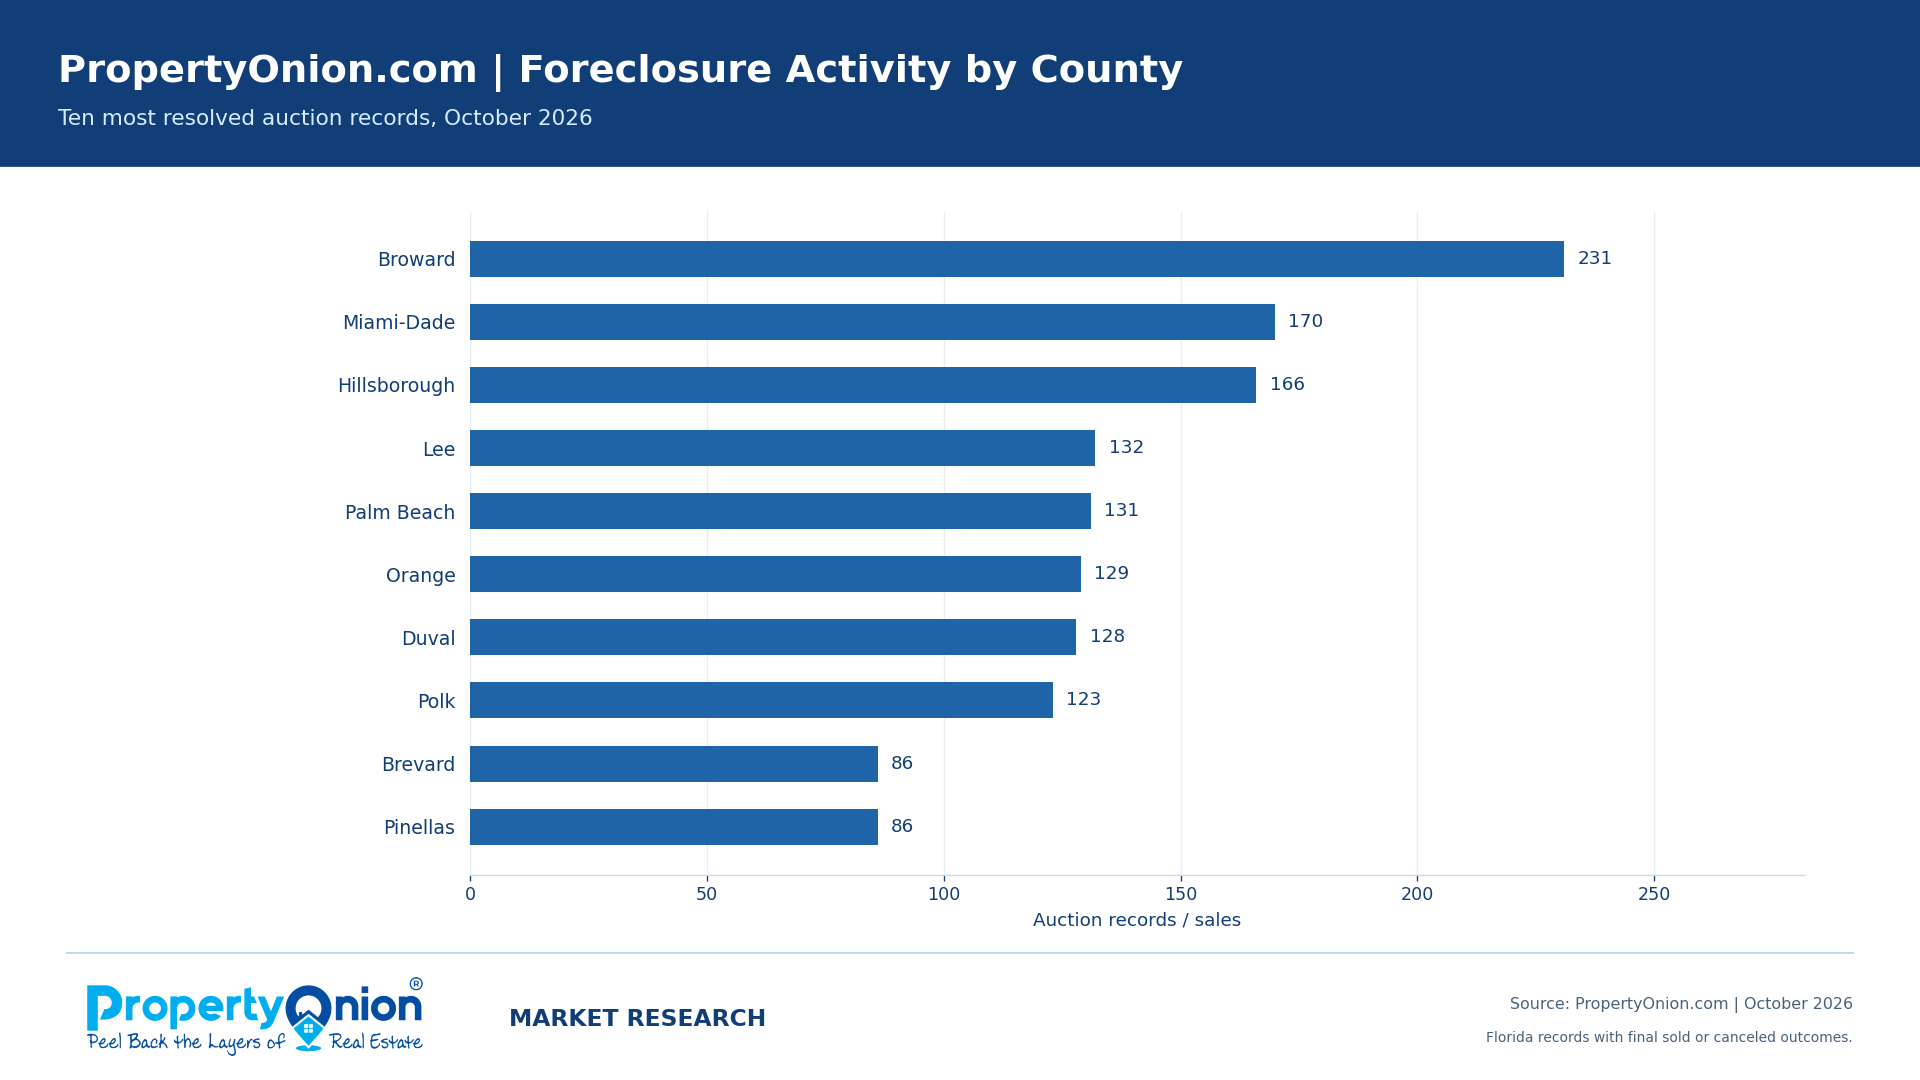
Broward had the most activity, but Miami-Dade had the higher outside-bidder share. Broward’s 41 third-party wins came from 94 sold auctions (43.6%); Miami-Dade recorded nearly as many outside purchases, 38, from only 74 sold auctions (51.4%). An investor examining just the total auction counts would miss that difference.
Miami-Dade and Orange stood out on third-party share. Among these ten high-volume counties, Miami-Dade’s outside bidders won 38 of 74 sales (51.4%), followed by Orange with 21 of 42 (50.0%). Palm Beach recorded 21 third-party wins out of 44 sales (47.7%), while Hillsborough had 35 of 78 (44.9%). These shares describe completed outcomes, not the probability of winning a future bid.
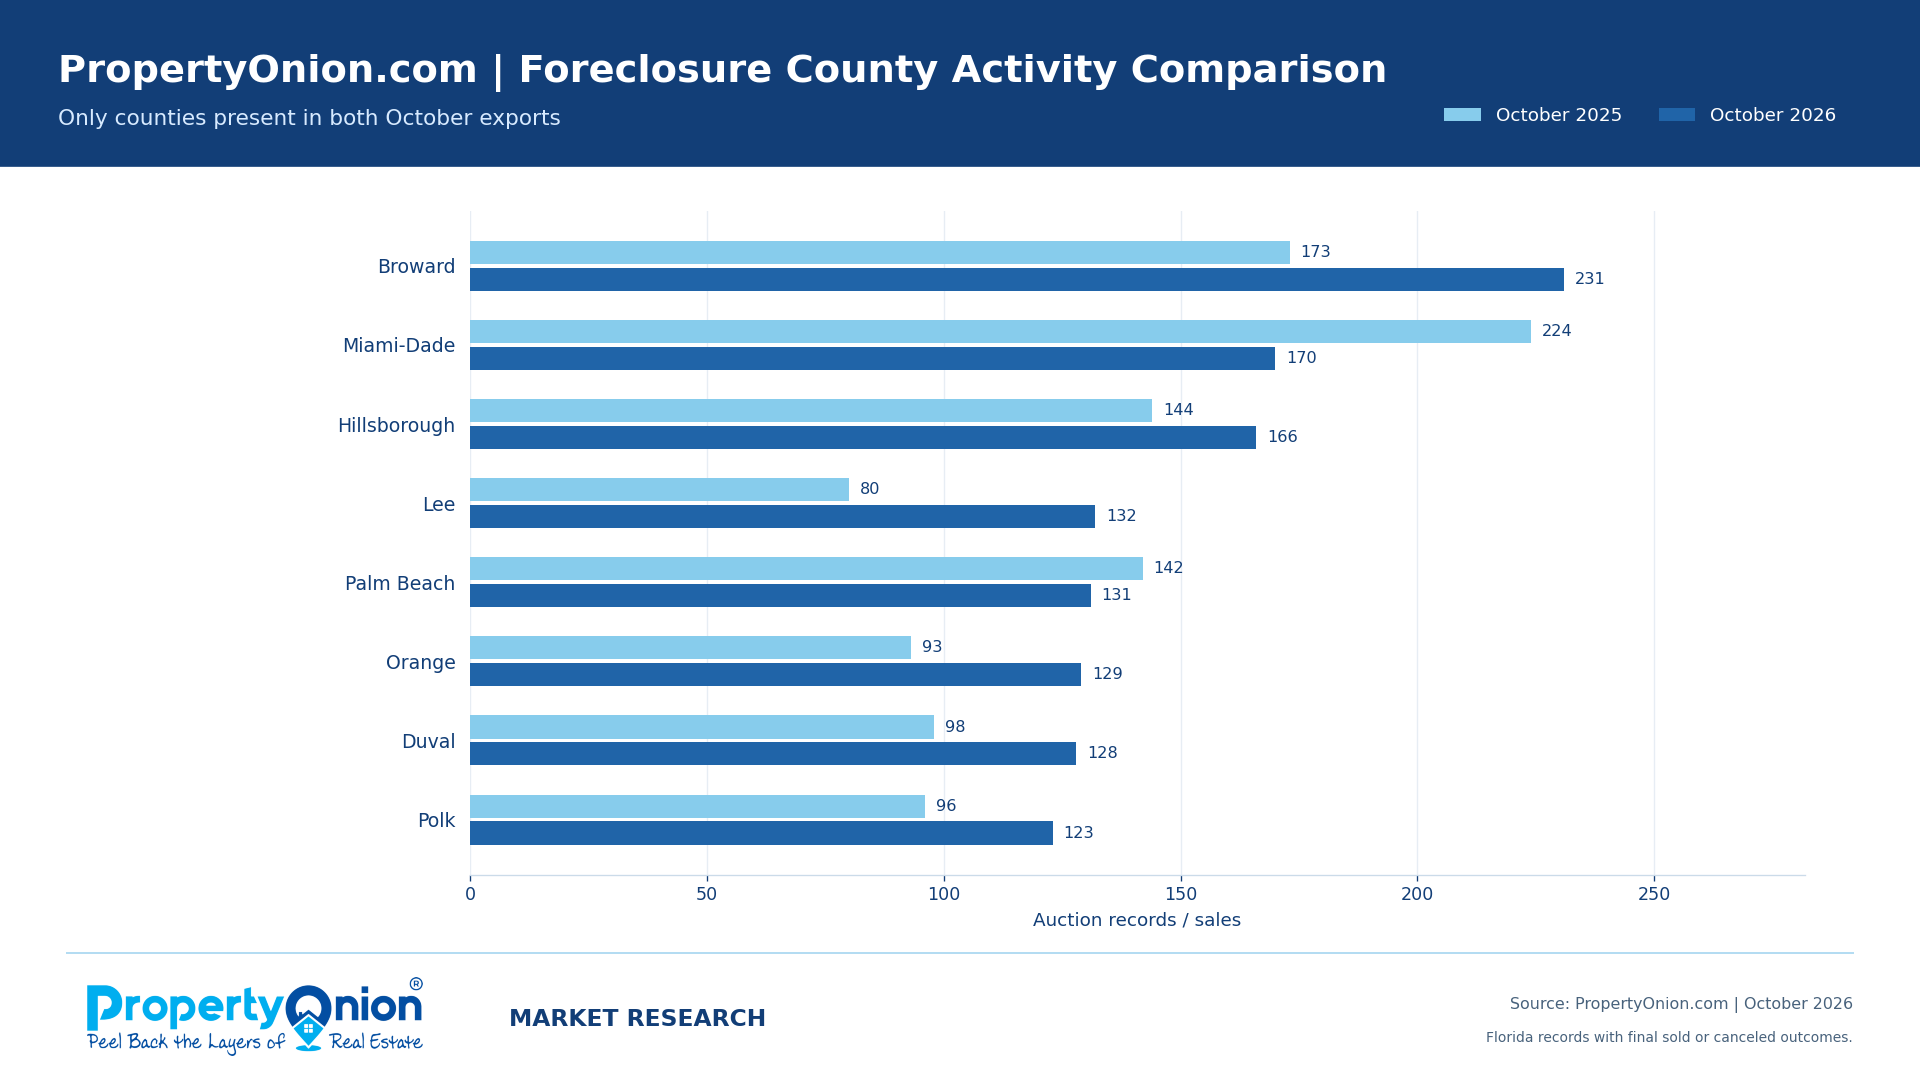
The county year-over-year chart adds a different lens: local recorded auction volume did not move uniformly, even as total completed sales increased across the exports. Those changes warrant county-specific research, not assumptions about why activity moved or which market will yield better returns.
Single-family properties dominated completed foreclosure sales
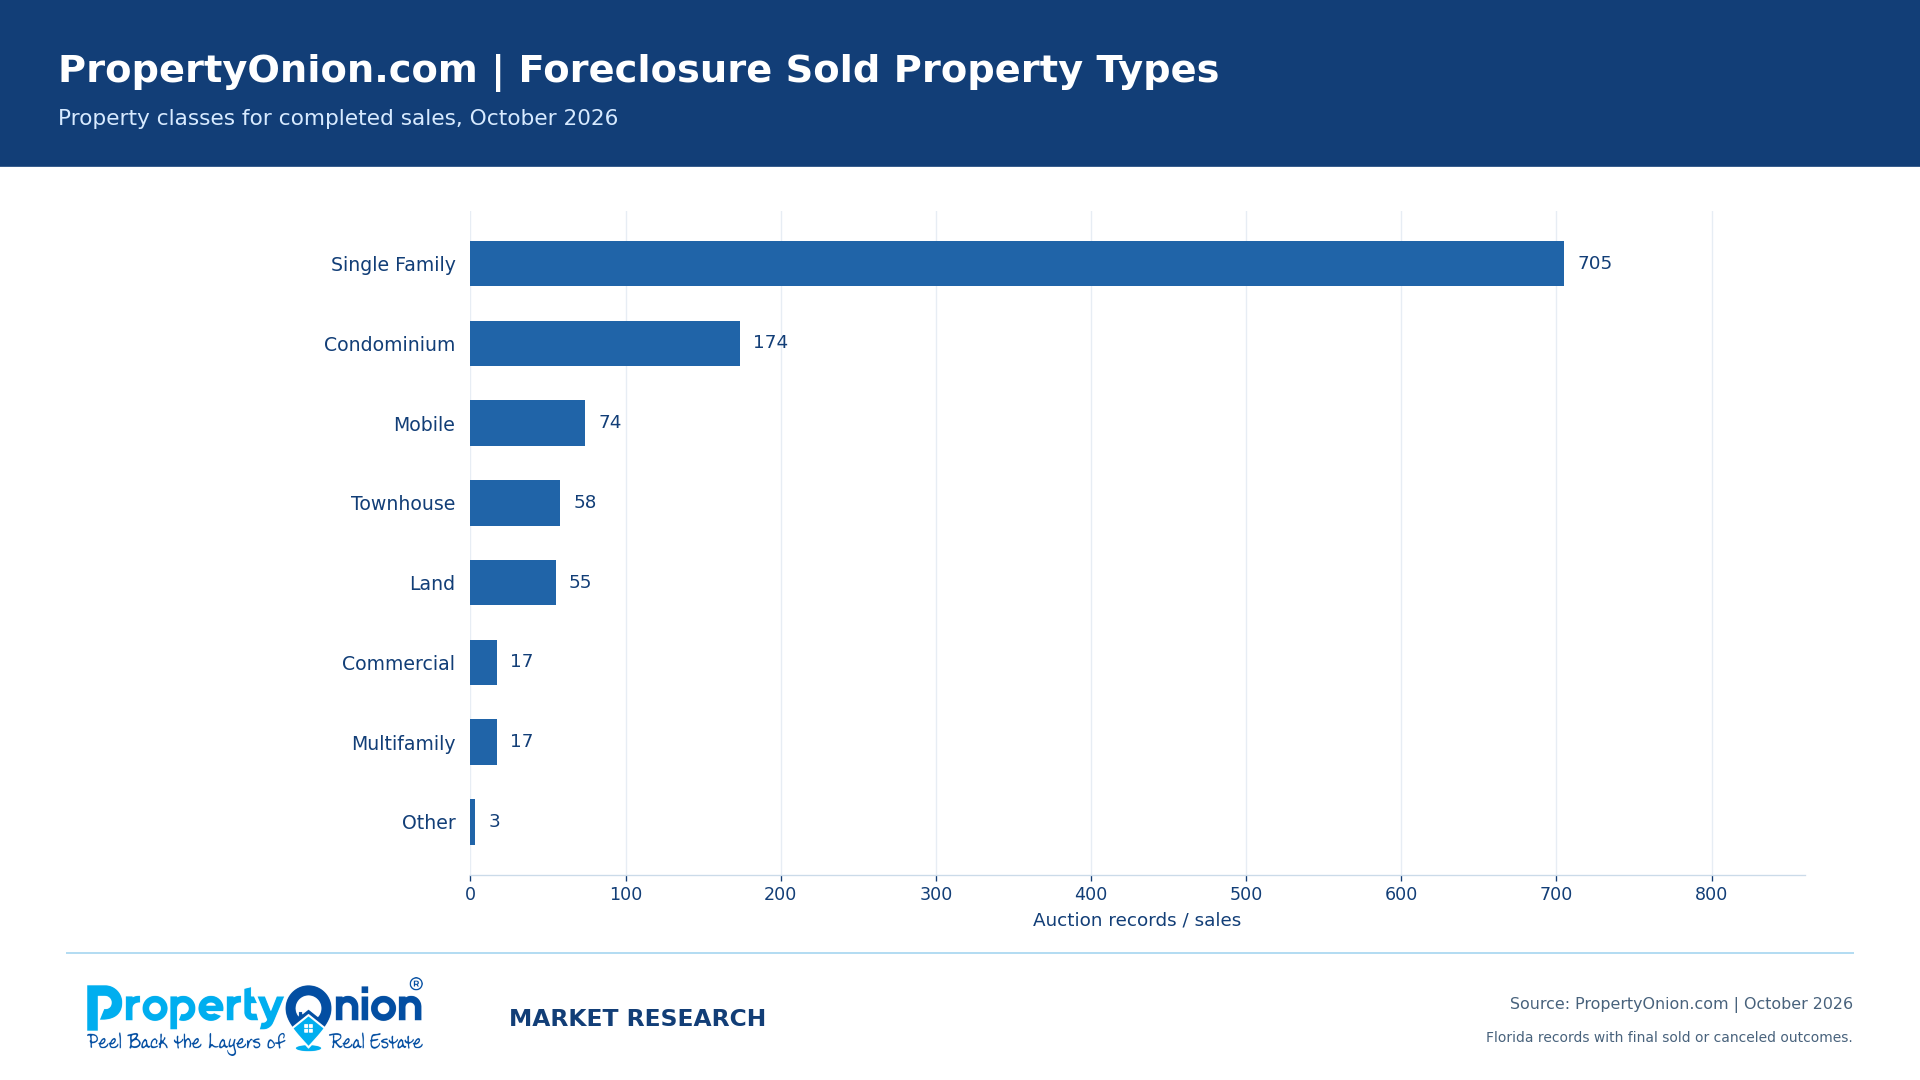
Single-family homes accounted for 705 of 1,103 October 2026 foreclosure sales (63.9%). Condominiums followed with 174 sales, then mobile properties with 74. The broader mix also included townhouses, land, multifamily and commercial properties. Because the asset types differ, a single auction-price median should not be treated as the price of a typical Florida property.
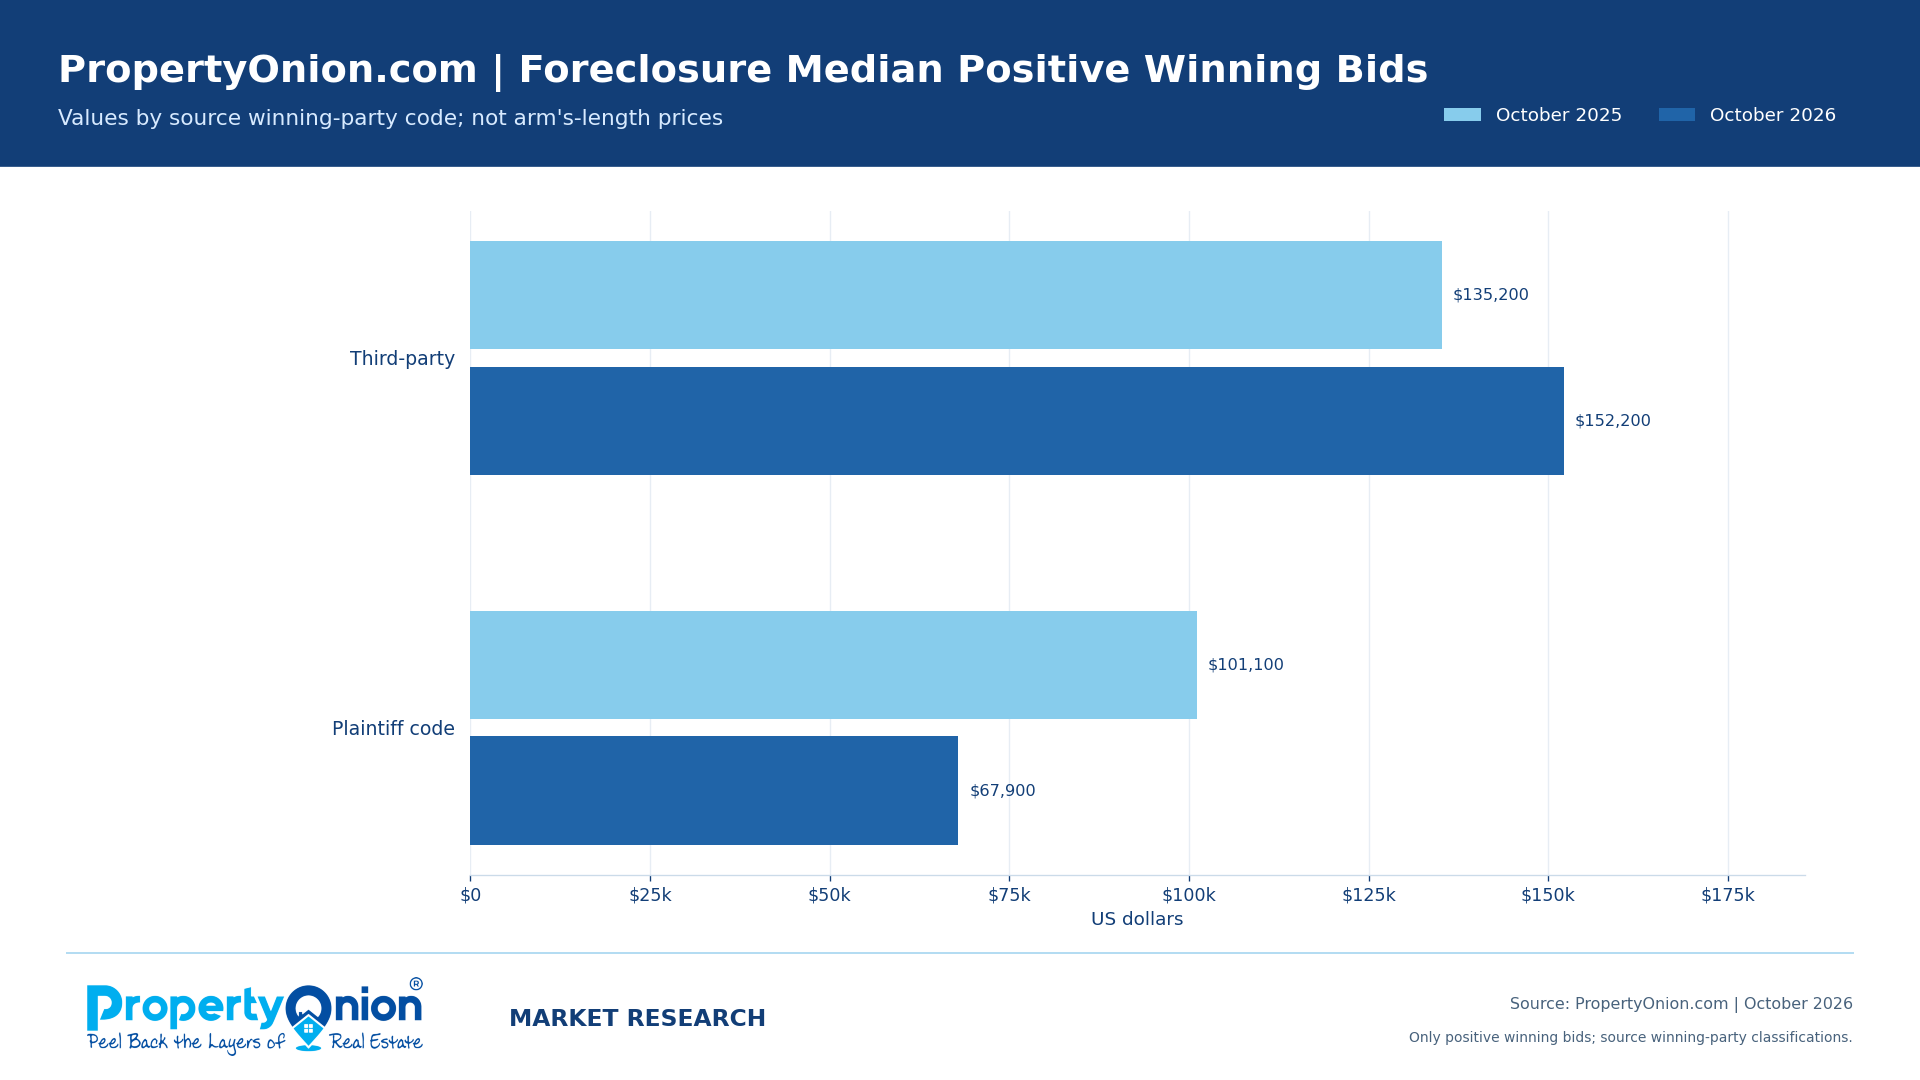
The median positive third-party winning bid reached $152,200 across 403 October 2026 purchases, versus $135,200 across 316 October 2025 purchases. The table below breaks out selected property types to show how widely reported bids vary. These auction bid medians are not conventional home-sale prices or independent appraisals.
| Property type | Sales | Positive third-party bids | Median bid |
|---|---|---|---|
| Single Family | 705 | 258 | $183,840 |
| Condominium | 174 | 67 | $46,000 |
| Mobile | 74 | 25 | $97,008 |
| Townhouse | 58 | 31 | $50,100 |
| Land | 55 | 15 | $50,400 |
| Commercial | 17 | 5 | $638,700 |
Property mix helps explain why bid medians differ. In the selected categories above, the median positive third-party bid was $183,840 for single-family properties (258 bids) and $46,000 for condominiums (67 bids). Those differences should guide property-type-specific comparisons, not be interpreted as price changes for comparable assets.
What third-party buyers bid versus estimated property values
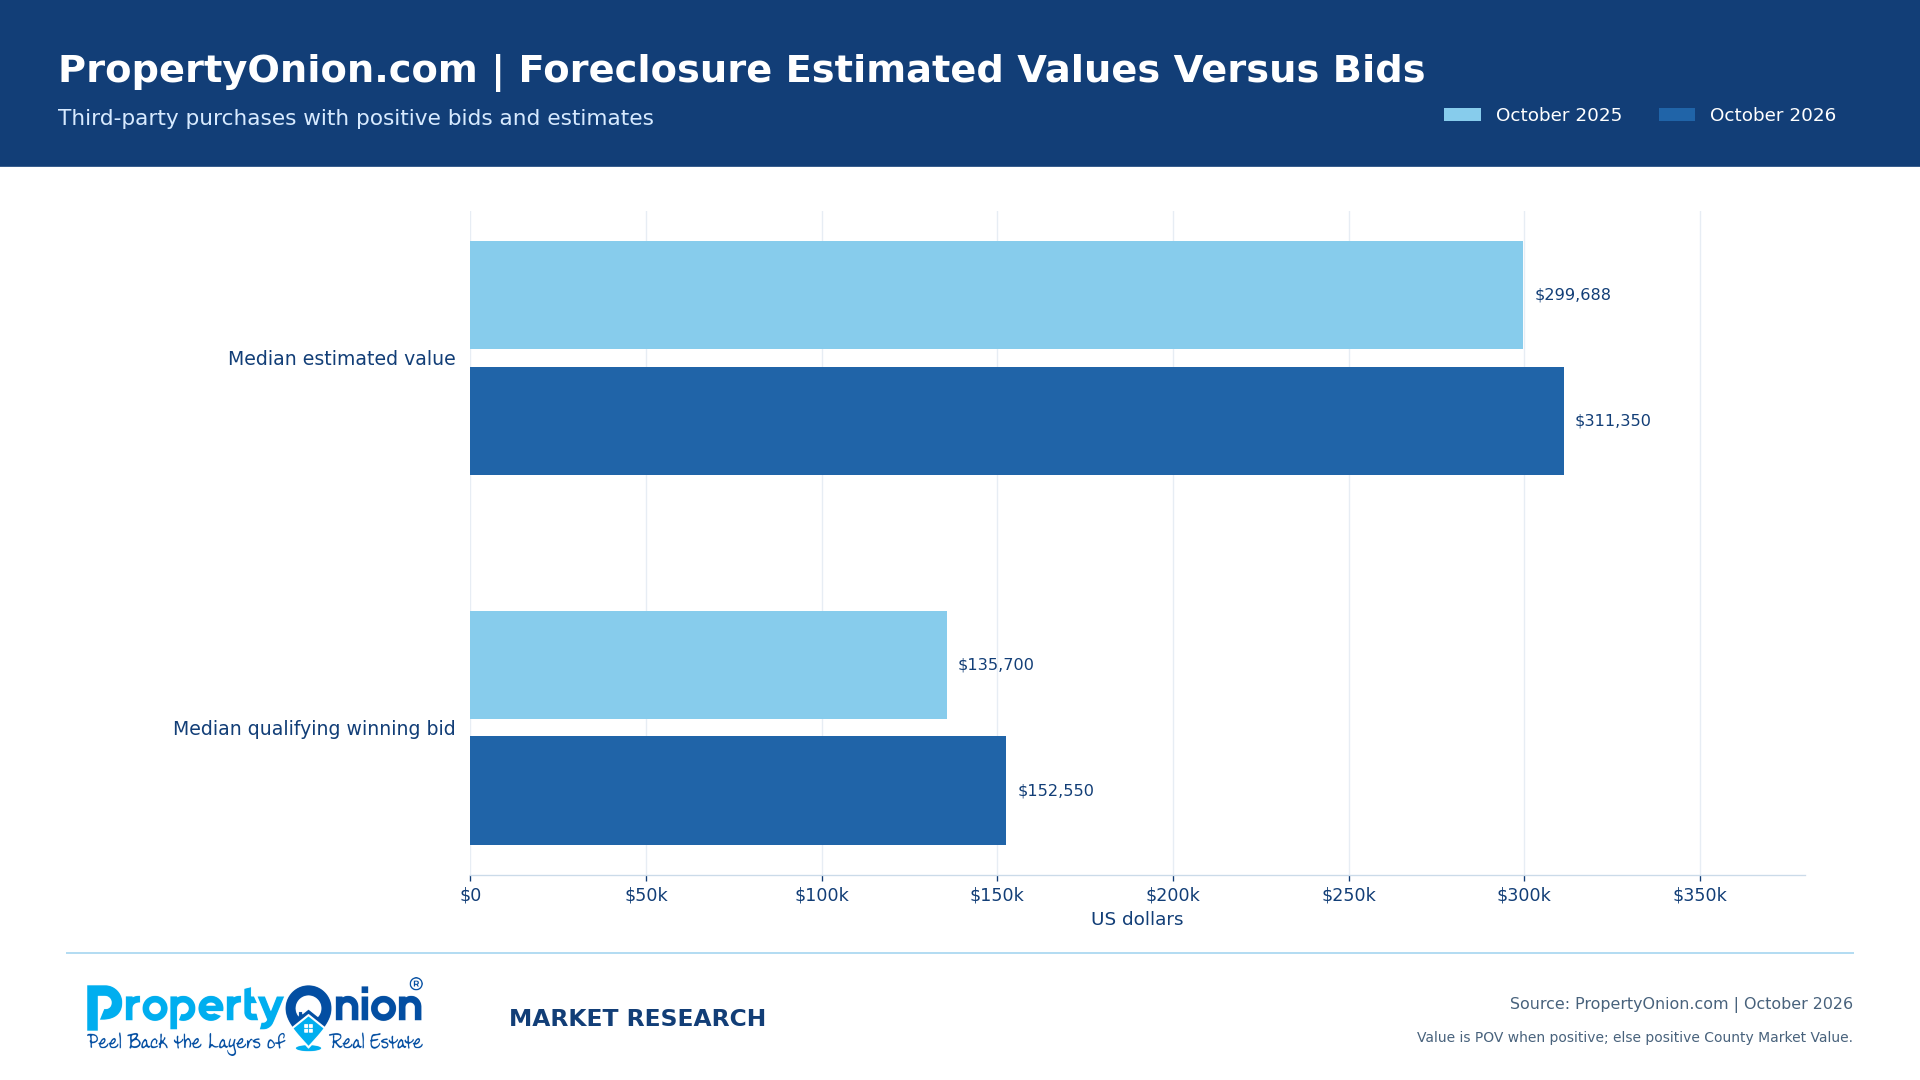
For October 2026, 396 of 403 third-party foreclosure purchases had both a positive winning bid and a qualifying estimated value. Of those 396, PropertyOnion used a positive PropertyOnion Value (POV) for 382 and a positive County Market Value for 14. The sample’s median estimated value was $311,350, and its separately calculated median winning bid was $152,550. Those two medians do not determine the apparent-discount figure.
| Third-party valuation metric | Oct. 2025 | Oct. 2026 |
|---|---|---|
| Third-party wins | 316 | 403 |
| Purchases with positive bid and estimate | 311 | 396 |
| Valuation source: POV | 306 | 382 |
| Valuation source: County Market Value | 5 | 14 |
| Median estimated value | $299,688 | $311,350 |
| Median qualifying bid | $135,700 | $152,550 |
| Median individual-property apparent discount | 46.5% | 45.0% |
| Bids below estimated value | 303 of 311 | 382 of 396 |
The median apparent discount was 45.0%, not a guaranteed return
For each eligible third-party purchase, PropertyOnion calculated (estimated property value – winning bid) / estimated property value, then took the median of those individual percentages. The result was 45.0% in October 2026, compared with 46.5% in October 2025, a decline of 1.5 percentage points. In 2026, 382 of 396 qualifying bids were below estimated value and 14 were at or above it.
An apparent discount is not verified equity or profit. Estimated values may differ from realizable resale prices. Surviving liens, unpaid assessments, title defects, occupancy, repairs, taxes, insurance, legal fees and transaction costs can materially change the economics of an individual purchase. Investors should evaluate those exposures against the specific property and court record before bidding.
Recorded cancellation reasons were concentrated in three categories
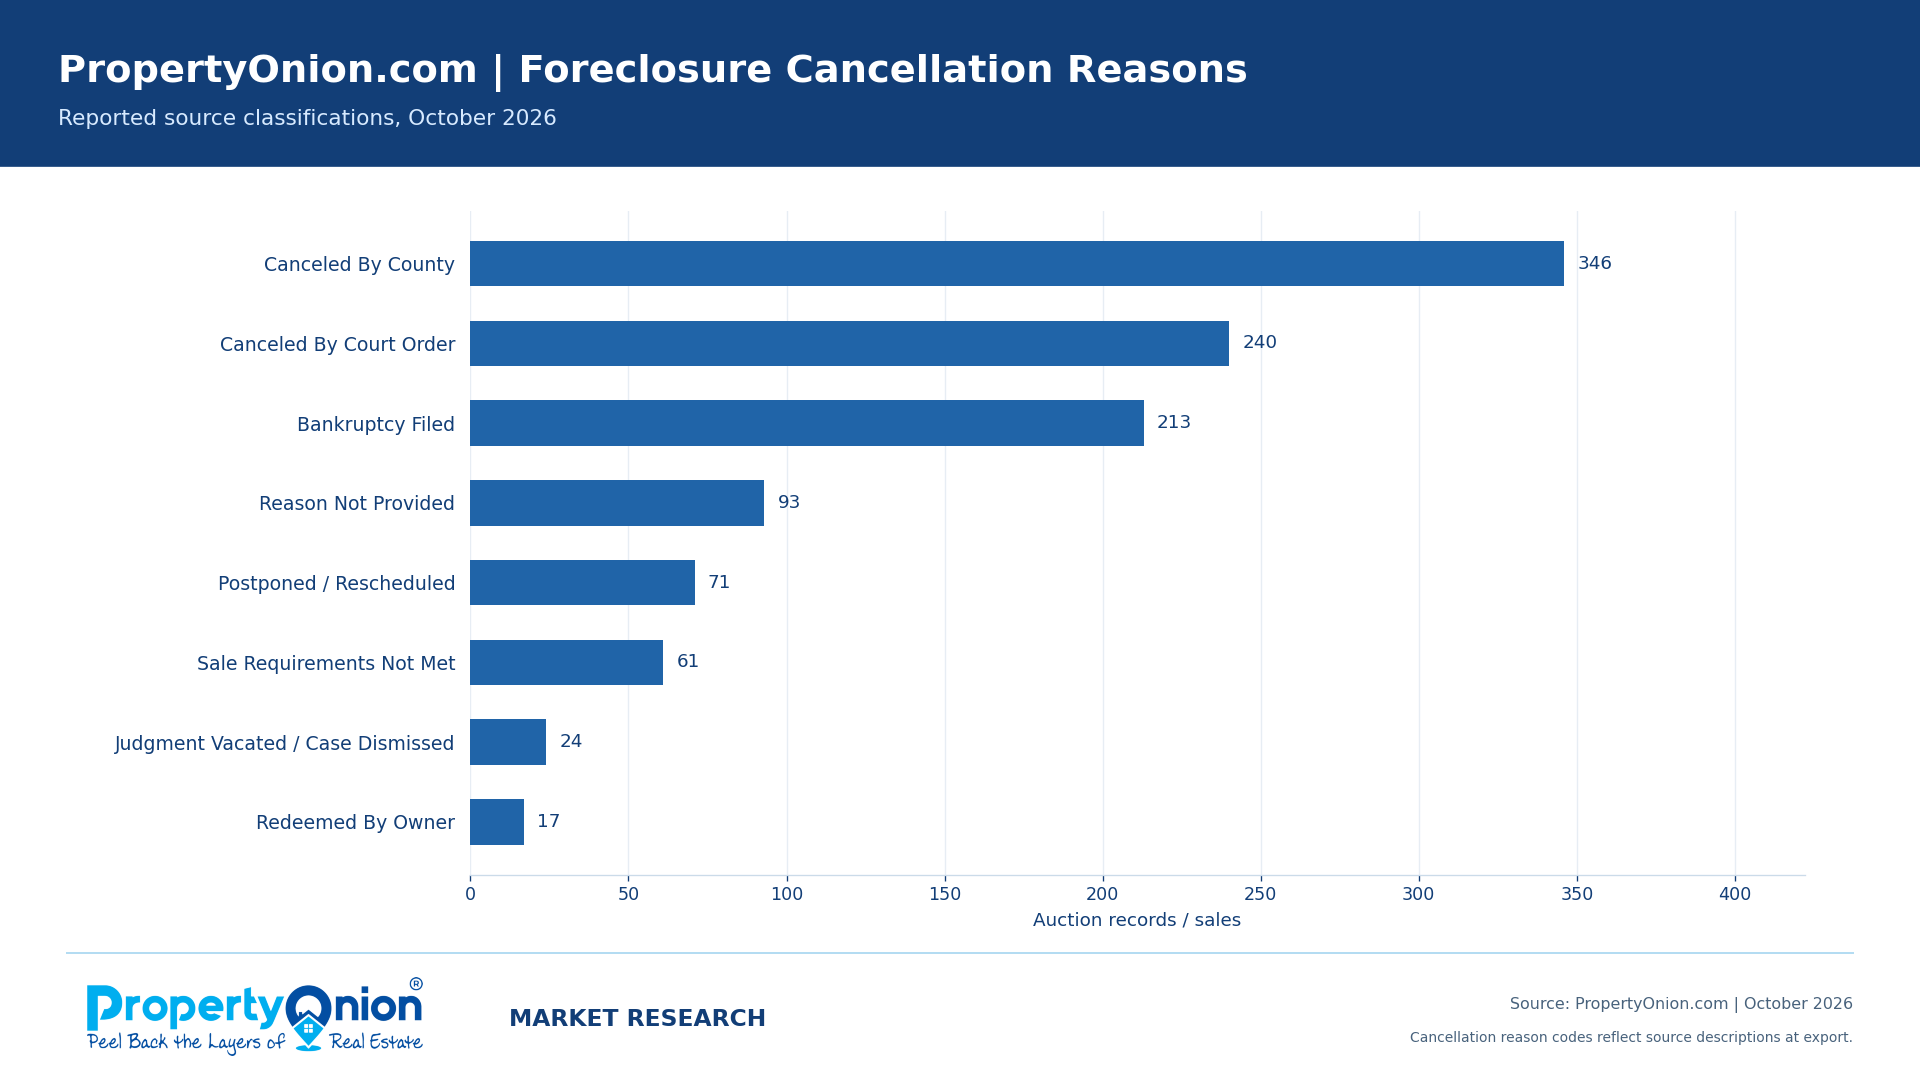
Of 1,070 canceled October 2026 foreclosure auctions, the leading source categories were “Canceled By County” (346), “Canceled By Court Order” (240) and “Bankruptcy Filed” (213). Together they accounted for 799 cancellations (74.7%). These labels are export classifications, not independent findings about the legal circumstances of each case. The October 2025 cancellation-reason field was not usable for a reliable year-over-year breakdown.
| Cancellation classification | October 2026 count |
|---|---|
| Canceled By County | 346 |
| Canceled By Court Order | 240 |
| Bankruptcy Filed | 213 |
| Reason Not Provided | 93 |
| Postponed / Rescheduled | 71 |
| Sale Requirements Not Met | 61 |
| Judgment Vacated / Case Dismissed | 24 |
| Redeemed By Owner | 17 |
| Canceled By Plaintiff | 3 |
| Sale Voided | 2 |
How investors can use the October 2026 results
Research activity and participation separately. Use resolved auction counts to identify counties with substantial case volume, then compare completed sales and third-party wins before drawing conclusions about investor participation. Review individual judgments, legal descriptions, county auction rules, deposits, lien priority and recorded obligations before selecting a property.
Build the entire acquisition budget, not just the bid. Factor in potential surviving debt, taxes and assessments, occupancy, title and legal work, repairs, holding costs and a defensible exit price. The monthly figures can focus due diligence and provide historical context, but they cannot establish which upcoming auction is a sound investment.
Frequently asked questions about October 2026 Florida foreclosure auctions
How many Florida foreclosure auctions sold in October 2026?
PropertyOnion recorded 1,103 sold foreclosure auctions and 1,070 cancellations among 2,173 resolved Florida foreclosure records in the October 2026 export. These are export-based findings, not an official count of every statewide auction.
What percentage of foreclosure sales did third-party investors win?
Third-party bidders won 403 of 1,103 sales (36.5%) in October 2026, down from 38.1% in October 2025. Two 2026 sales had an unclassified winner and remain in the sales total.
Which county had the most resolved foreclosure auctions?
Broward led October 2026 with 231 resolved records, including 94 sold auctions and 41 third-party purchases. A high resolved count does not, by itself, mean a high share of third-party wins.
Does a 45.0% apparent discount mean a profitable foreclosure purchase?
No. The 45.0% figure is the median property-level difference between winning bids and selected estimated values for 396 qualifying third-party sales. It does not establish clean title, verified equity, resale value or a positive return after expenses.
Are the October year-over-year changes a complete Florida market measure?
No. The exports cover 40 counties in October 2025 and 43 in October 2026, and the 2026 data ends October 30. The same-county analysis helps compare like geographic groups, but differences in source capture and auction schedules may remain.
Research methodology and limitations
Publisher and source: PropertyOnion.com Market Research analyzed its Florida foreclosure auction CSV exports for October 2025 and October 2026. Records were included only when State = FL, Listing Type = Foreclosure, and Auction Status = Sold or Canceled. The unit is an auction record, not necessarily a distinct parcel; a case or property may appear again for a different auction date.
Reporting coverage: October 2025 covers 10-01-2025 to 10-31-2025 across 40 named counties. October 2026 covers 10-01-2026 to 10-30-2026 across 43 named counties, with 40 common counties. Geographic and time-period differences limit direct statewide interpretation. Source snapshots may also change after later corrections.
Winner classifications: “3rd Party” identifies an outside purchaser, while “Plaintiff” identifies the foreclosing party in the source. The spelling “Plantiff” was normalized to “Plaintiff” where encountered. Unclassified sales remain in the sold total. Plaintiff winning bids may reflect credit bids rather than cash purchases.
Valuation method: Only third-party sales with positive bids and positive selected values qualify. Use positive POV first; if unavailable or not positive, use positive County Market Value. Apparent discount is calculated for each property as (value – bid) / value, then summarized by the median. The 2026 valuation sample includes 396 purchases, of which 382 use POV and 14 use County Market Value; the 2025 sample includes 311. The estimates do not deduct surviving obligations or purchase costs.
Interpretation limits: A Sold status is not independent confirmation of title transfer. County reporting, subsequent source revisions and the unusable October 2025 cancellation-reason breakdown constrain certain comparisons. Auction classifications and estimates were not independently audited against every court or property record. This is original export-based market research, not a legal opinion or a property-level valuation.
About PropertyOnion Market Research
PropertyOnion.com publishes original Florida auction research for real estate investors using its auction export snapshots and disclosed analysis methods. Explore the PropertyOnion Market Research archive or compare this report with September 2026 Florida Foreclosure Auction Statistics. These reports supplement, but do not replace, official county auction and court records.
Research appendix: complete October county comparisons
This expandable table retains the county-level October 2025 and October 2026 foreclosure record counts, current-year sales and third-party wins, and changes where comparable. These figures use the same resolved-outcome definitions as the main report.
Show the complete county comparison
Scroll table horizontally to view all columns.
| County | 2025 records | 2026 records | 2026 sold | 2026 third-party | Records change |
|---|---|---|---|---|---|
| Broward | 173 | 231 | 94 | 41 | +33.5% |
| Miami-Dade | 224 | 170 | 74 | 38 | -24.1% |
| Hillsborough | 144 | 166 | 78 | 35 | +15.3% |
| Lee | 80 | 132 | 83 | 29 | +65.0% |
| Palm Beach | 142 | 131 | 44 | 21 | -7.7% |
| Orange | 93 | 129 | 42 | 21 | +38.7% |
| Duval | 98 | 128 | 65 | 24 | +30.6% |
| Polk | 96 | 123 | 67 | 30 | +28.1% |
| Brevard | 99 | 86 | 52 | 16 | -13.1% |
| Pinellas | 55 | 86 | 53 | 16 | +56.4% |
| Volusia | 61 | 71 | 39 | 5 | +16.4% |
| Pasco | 46 | 58 | 34 | 13 | +26.1% |
| Marion | 49 | 51 | 38 | 7 | +4.1% |
| Lake | 25 | 43 | 21 | 5 | +72.0% |
| Clay | 19 | 42 | 20 | 6 | +121.1% |
| Charlotte | 31 | 41 | 26 | 2 | +32.3% |
| Escambia | 40 | 40 | 19 | 9 | +0.0% |
| Seminole | 24 | 37 | 11 | 4 | +54.2% |
| Osceola | 47 | 35 | 23 | 7 | -25.5% |
| St. Lucie | 35 | 35 | 19 | 8 | +0.0% |
| Manatee | 36 | 32 | 14 | 7 | -11.1% |
| Citrus | 13 | 31 | 22 | 9 | +138.5% |
| Santa Rosa | 11 | 28 | 19 | 4 | +154.5% |
| Sarasota | 27 | 26 | 18 | 6 | -3.7% |
| Bay | 24 | 23 | 16 | 7 | -4.2% |
| Hernando | 18 | 22 | 12 | 4 | +22.2% |
| Leon | 27 | 19 | 9 | 4 | -29.6% |
| Okaloosa | 2 | 19 | 6 | 0 | +850.0% |
| Indian River | 9 | 15 | 6 | 2 | +66.7% |
| St. Johns | 16 | 15 | 11 | 3 | -6.2% |
| Alachua | 12 | 14 | 9 | 4 | +16.7% |
| Collier | 23 | 14 | 10 | 2 | -39.1% |
| Flagler | 11 | 14 | 12 | 3 | +27.3% |
| Nassau | 4 | 12 | 6 | 2 | +200.0% |
| Highlands | – | 10 | 6 | 4 | – |
| Putnam | 5 | 10 | 7 | 0 | +100.0% |
| Walton | 13 | 8 | 5 | 1 | -38.5% |
| Baker | – | 7 | 4 | 2 | – |
| Jackson | 9 | 7 | 6 | 1 | -22.2% |
| Martin | 7 | 4 | 0 | 0 | -42.9% |
| Okeechobee | 5 | 4 | 1 | 0 | -20.0% |
| Gilchrist | – | 2 | 1 | 1 | – |
| Washington | 6 | 2 | 1 | 0 | -66.7% |
Suggested citation: PropertyOnion Market Research, “Florida Foreclosure Auction Market Report: October 2026,” November 2026. Attribute individual findings to PropertyOnion’s Florida foreclosure auction export analysis and retain the relevant reporting-period and valuation qualifications.




Comments