PropertyOnion Market Research | September 2026 | Florida foreclosure auctions
PropertyOnion analyzed 1,983 Florida foreclosure auction records with reported sold or canceled outcomes for September 2026. The comparable September 2025 export contained 1,616 records. The analysis excludes tax deed auctions and all records without a final sold or canceled outcome.
Executive summary
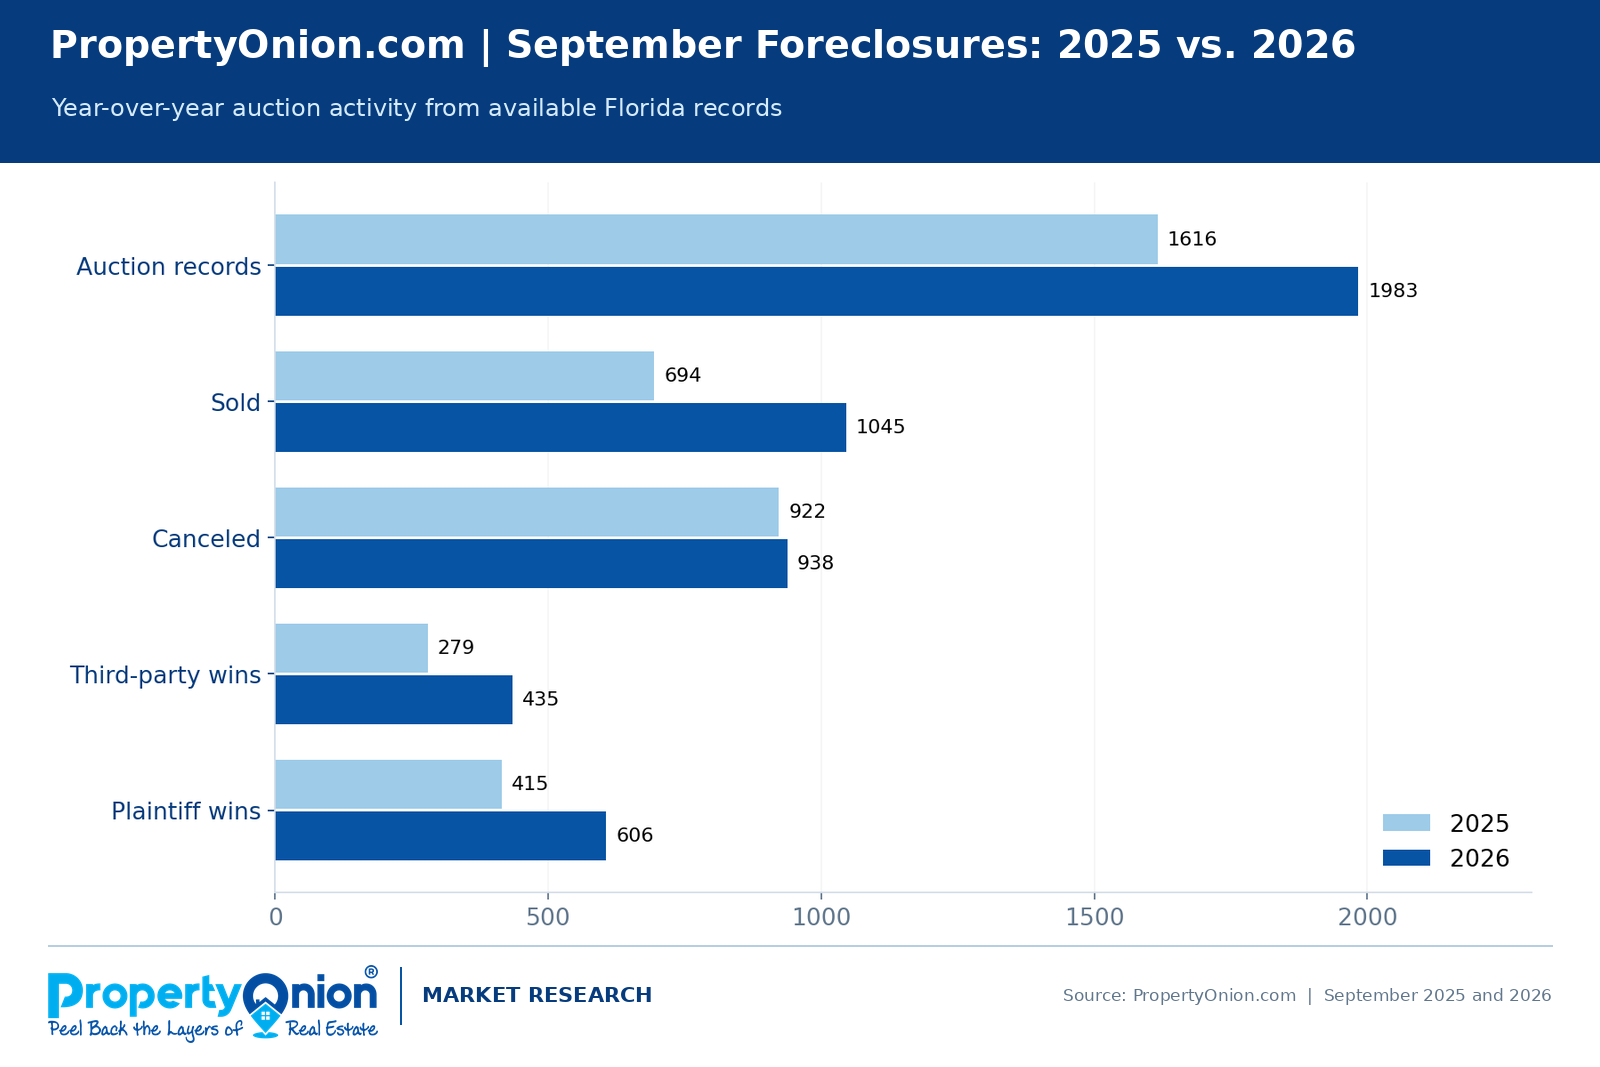
Florida foreclosure auction records with reported outcomes increased 22.7% year over year in PropertyOnion’s available datasets. Reported sales rose from 694 to 1,045, a 50.6% increase. Third-party wins increased from 279 to 435, up 55.9%. Cancellations changed little, from 922 to 938.
The results indicate higher recorded auction activity and more successful third-party bids within the supplied data. They do not, by themselves, establish statewide market growth: geographic coverage differs between the two exports.
Key findings at a glance
Source: PropertyOnion.com. Data covers available foreclosure records, not necessarily every Florida auction. Apparent discounts do not account for surviving liens or acquisition costs.
September 2026 Florida foreclosure auction outcomes
| Outcome | Records | Share |
|---|---|---|
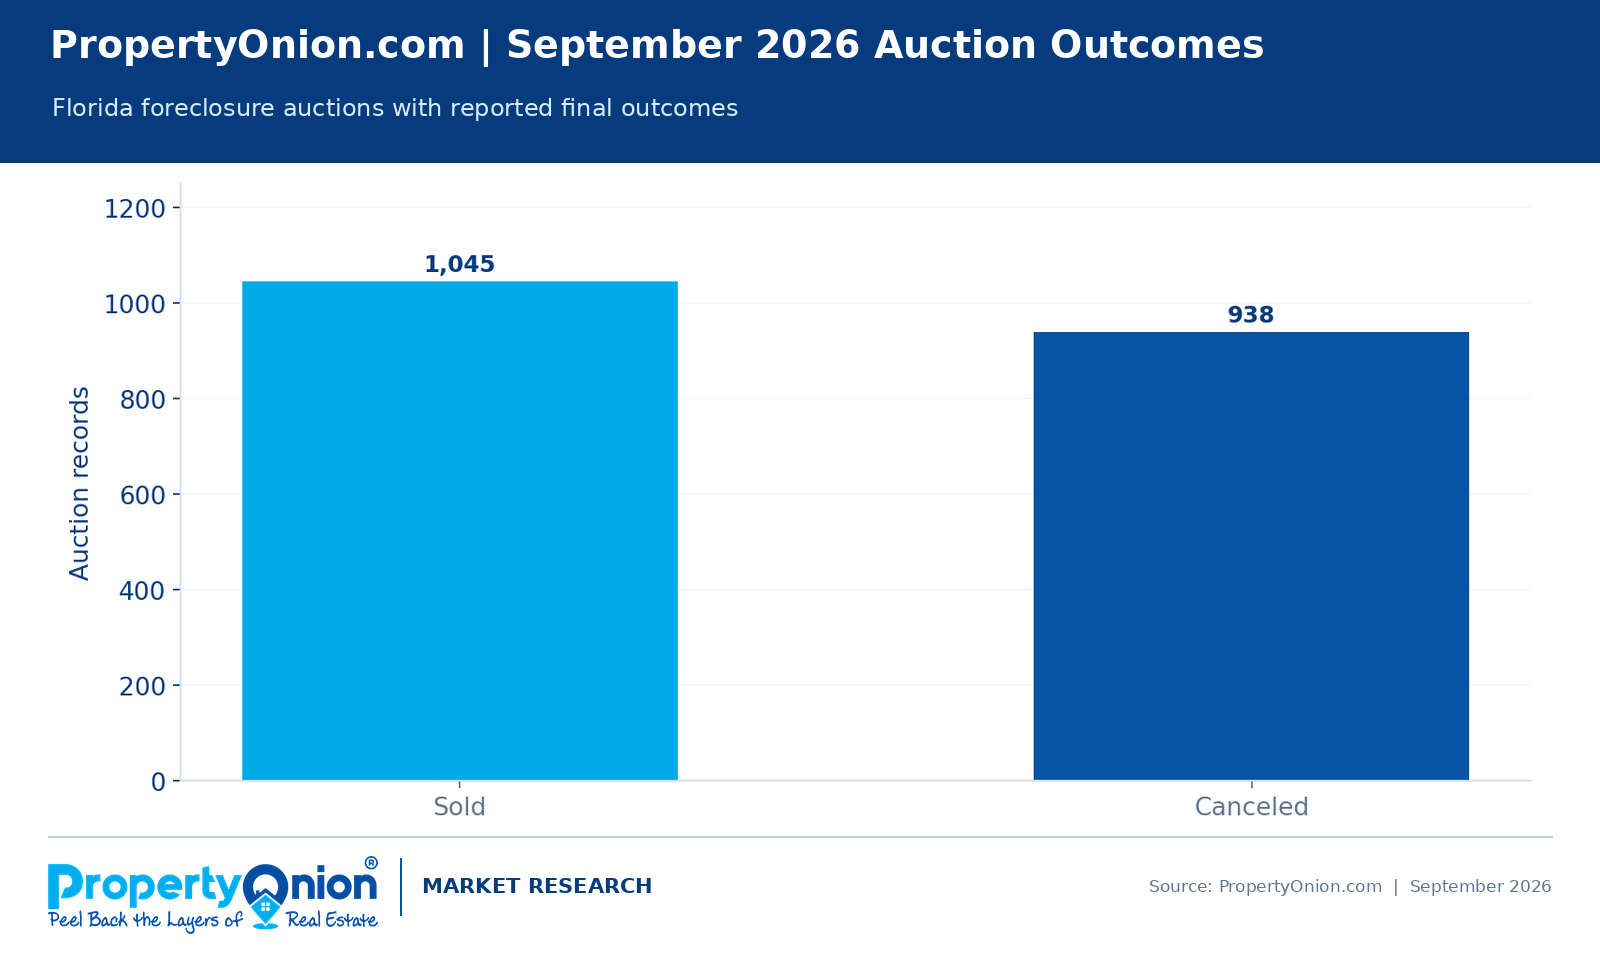
| Sold | 1,045 | 52.7% |
| Canceled | 938 | 47.3% |
| Total | 1,983 | 100.0% |
Of the 1,983 foreclosure auction records included in this analysis, 1,045 were reported sold and 938 were canceled. A canceled auction is not equivalent to a completed sale, so investors should distinguish scheduled auction volume from auctions that actually result in a winning bid.
Third-party investor purchases versus plaintiff wins
| Winning party | Sold records | Share of sales |
|---|---|---|
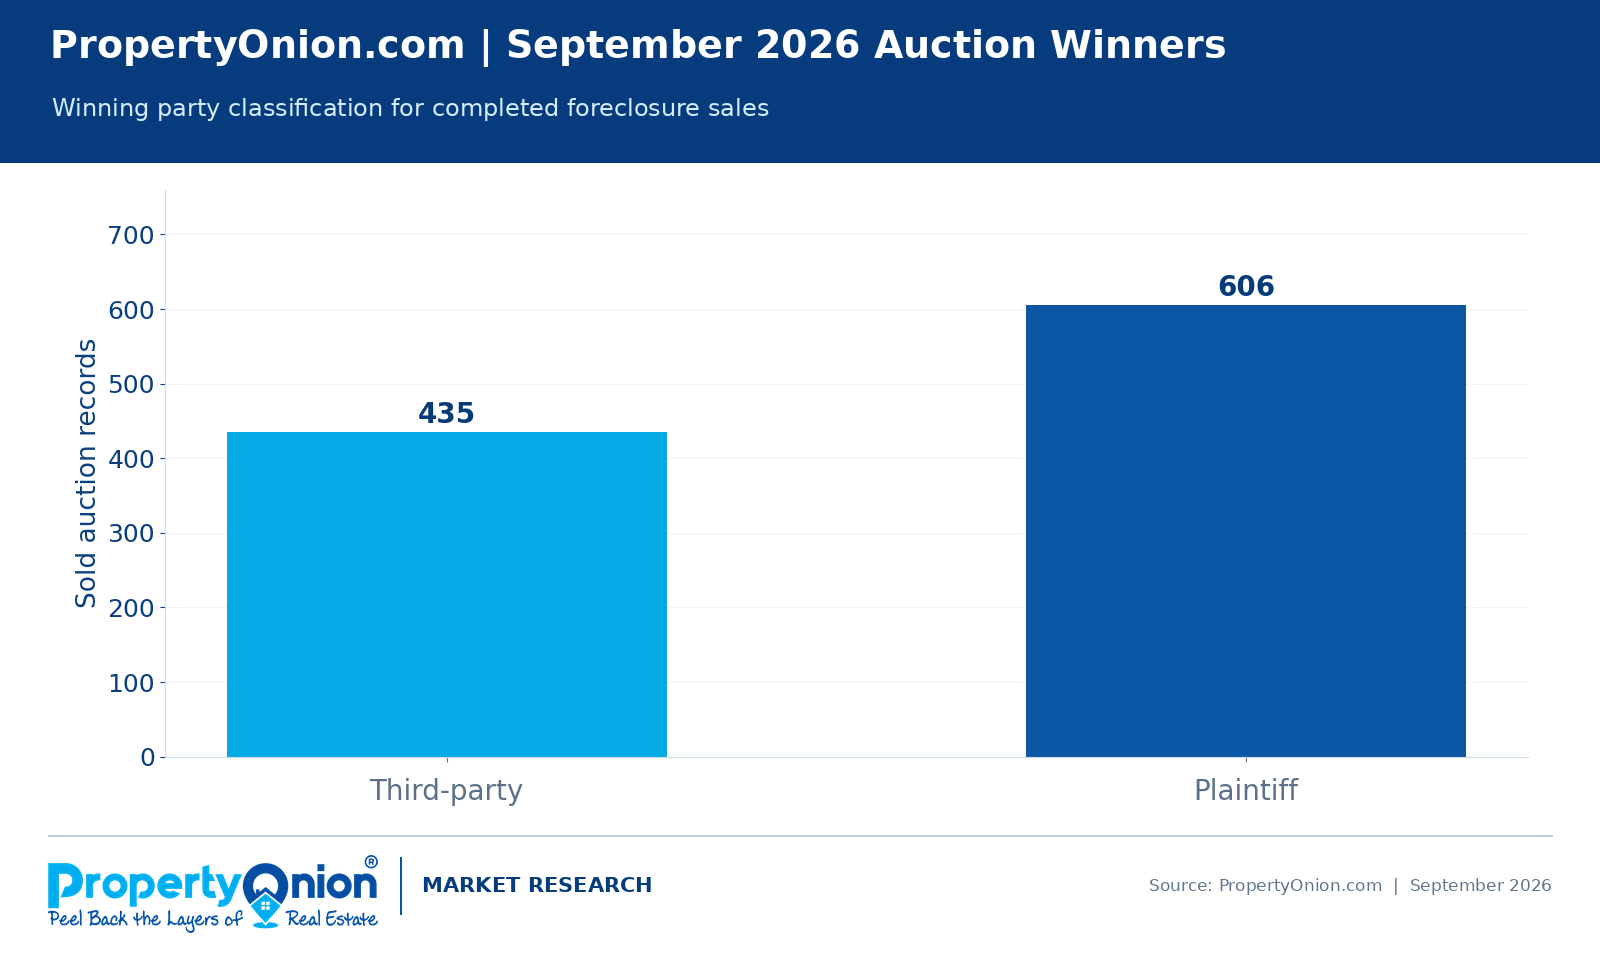
| Third-party purchaser | 435 | 41.6% |
| Plaintiff | 606 | 58.0% |
| Winner not identified | 4 | 0.4% |
| Total | 1,045 | 100.0% |
Third-party bidders won 435 foreclosure auctions, representing 41.6% of all reported sales. Plaintiffs won 606, or 58.0%. Four additional sold records had no identified winner and are excluded from the winning-party chart. The third-party winning share is a useful indicator of investor participation, but it is not a measure of profitability or the number of unique investors.
September 2026 foreclosure auctions by county
| County | Total | Sold | Canceled | Third-party wins |
|---|---|---|---|---|
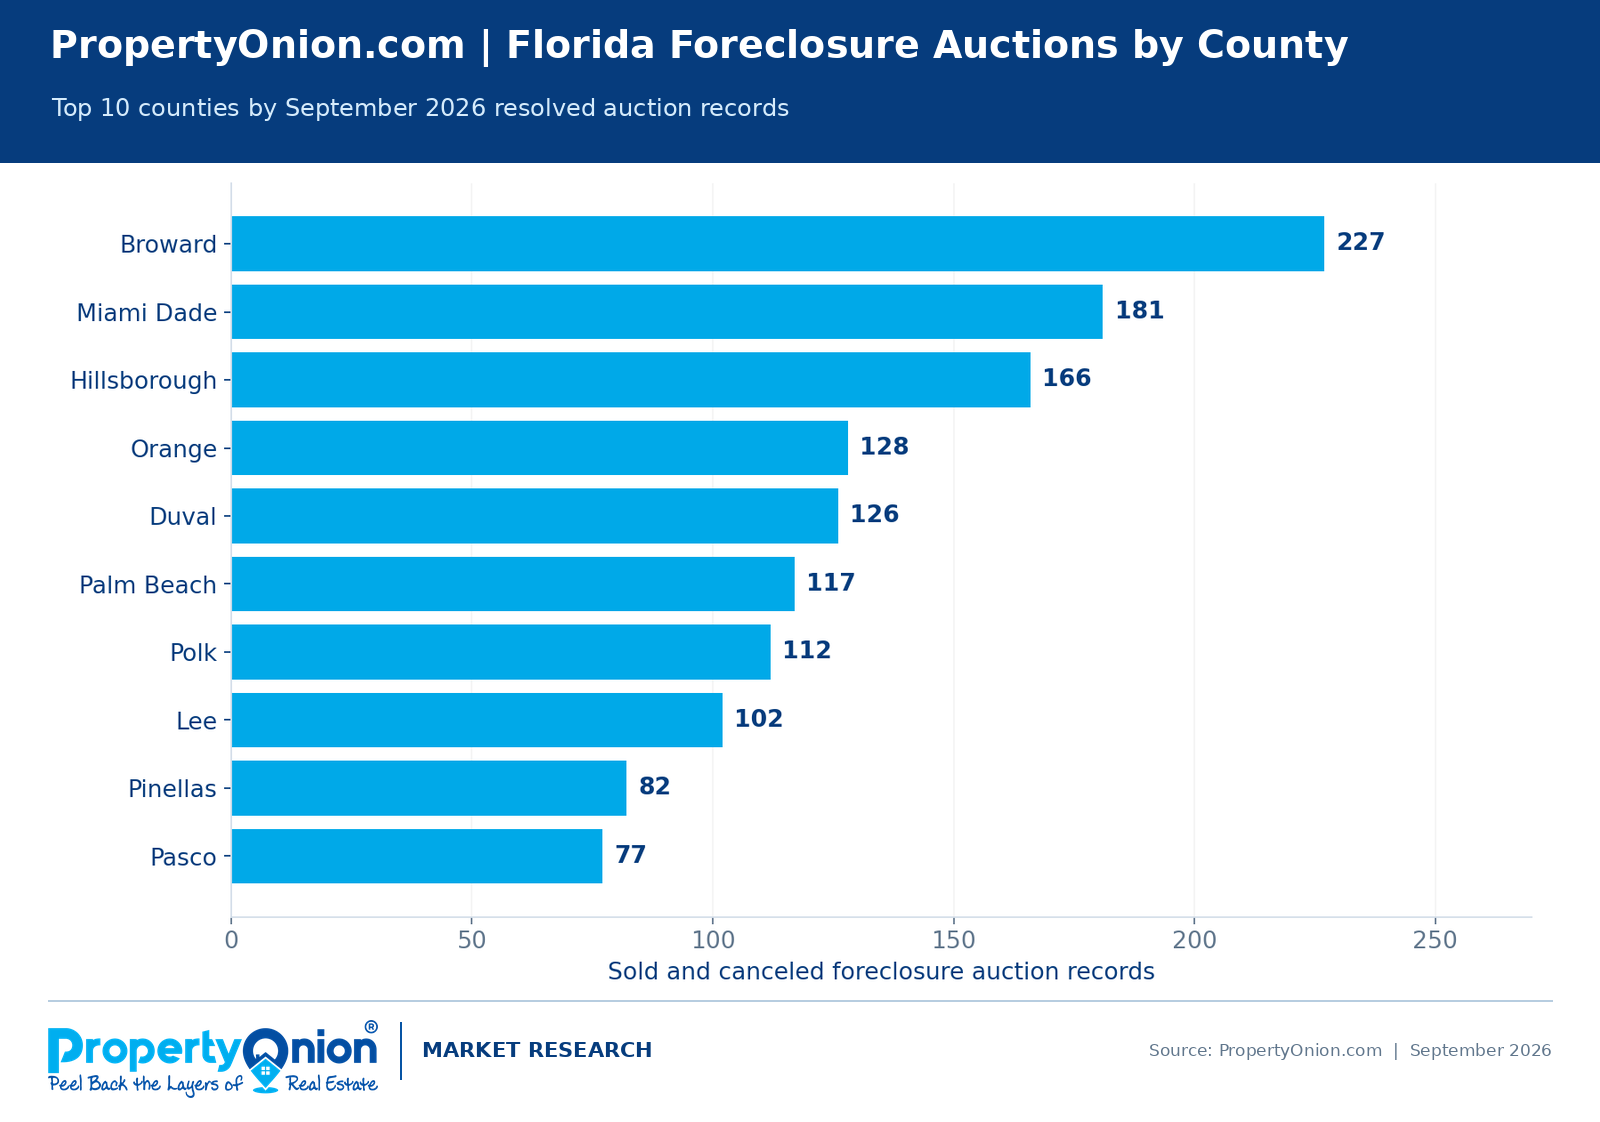
| Broward | 227 | 100 | 127 | 43 |
| Miami Dade | 181 | 77 | 104 | 33 |
| Hillsborough | 166 | 85 | 81 | 38 |
| Orange | 128 | 51 | 77 | 21 |
| Duval | 126 | 75 | 51 | 38 |
| Palm Beach | 117 | 46 | 71 | 20 |
| Polk | 112 | 75 | 37 | 31 |
| Lee | 102 | 70 | 32 | 23 |
| Pinellas | 82 | 41 | 41 | 20 |
| Pasco | 77 | 57 | 20 | 22 |
Broward, Miami-Dade, and Hillsborough led the September 2026 dataset by auction volume. However, county rankings based solely on auction counts can be misleading. Cancellations and the proportion of auctions won by third-party bidders also matter when evaluating where to focus research.
September 2025 versus September 2026: year-over-year trends
| Metric | Sept. 2025 | Sept. 2026 | YoY change |
|---|---|---|---|
| Auction records | 1,616 | 1,983 | +22.7% |
| Sold | 694 | 1,045 | +50.6% |
| Canceled | 922 | 938 | +1.7% |
| Third-party wins | 279 | 435 | +55.9% |
| Plaintiff wins | 415 | 606 | +46.0% |
The September 2026 dataset contains 367 more foreclosure auction records with final outcomes than September 2025. Completed sales increased by 351, while cancellations increased by 16. Third-party wins increased by 156 and plaintiff wins increased by 191.
Sold and canceled outcome rates
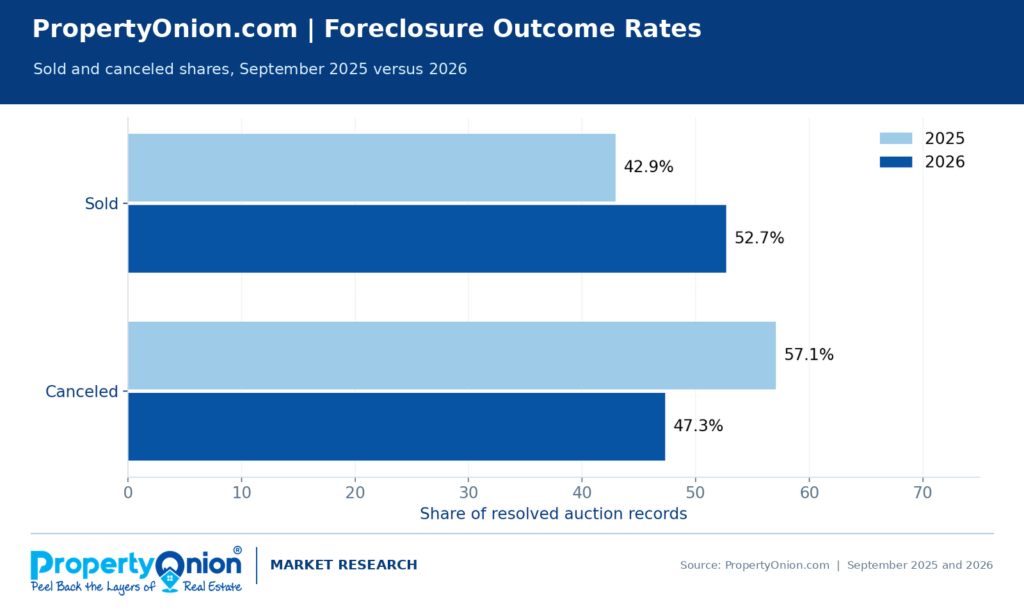
The reported sold share increased from 42.9% in September 2025 to 52.7% in September 2026. The canceled share decreased from 57.1% to 47.3%. Both years use only sold and canceled records for this comparison.
Changes in winning-party participation
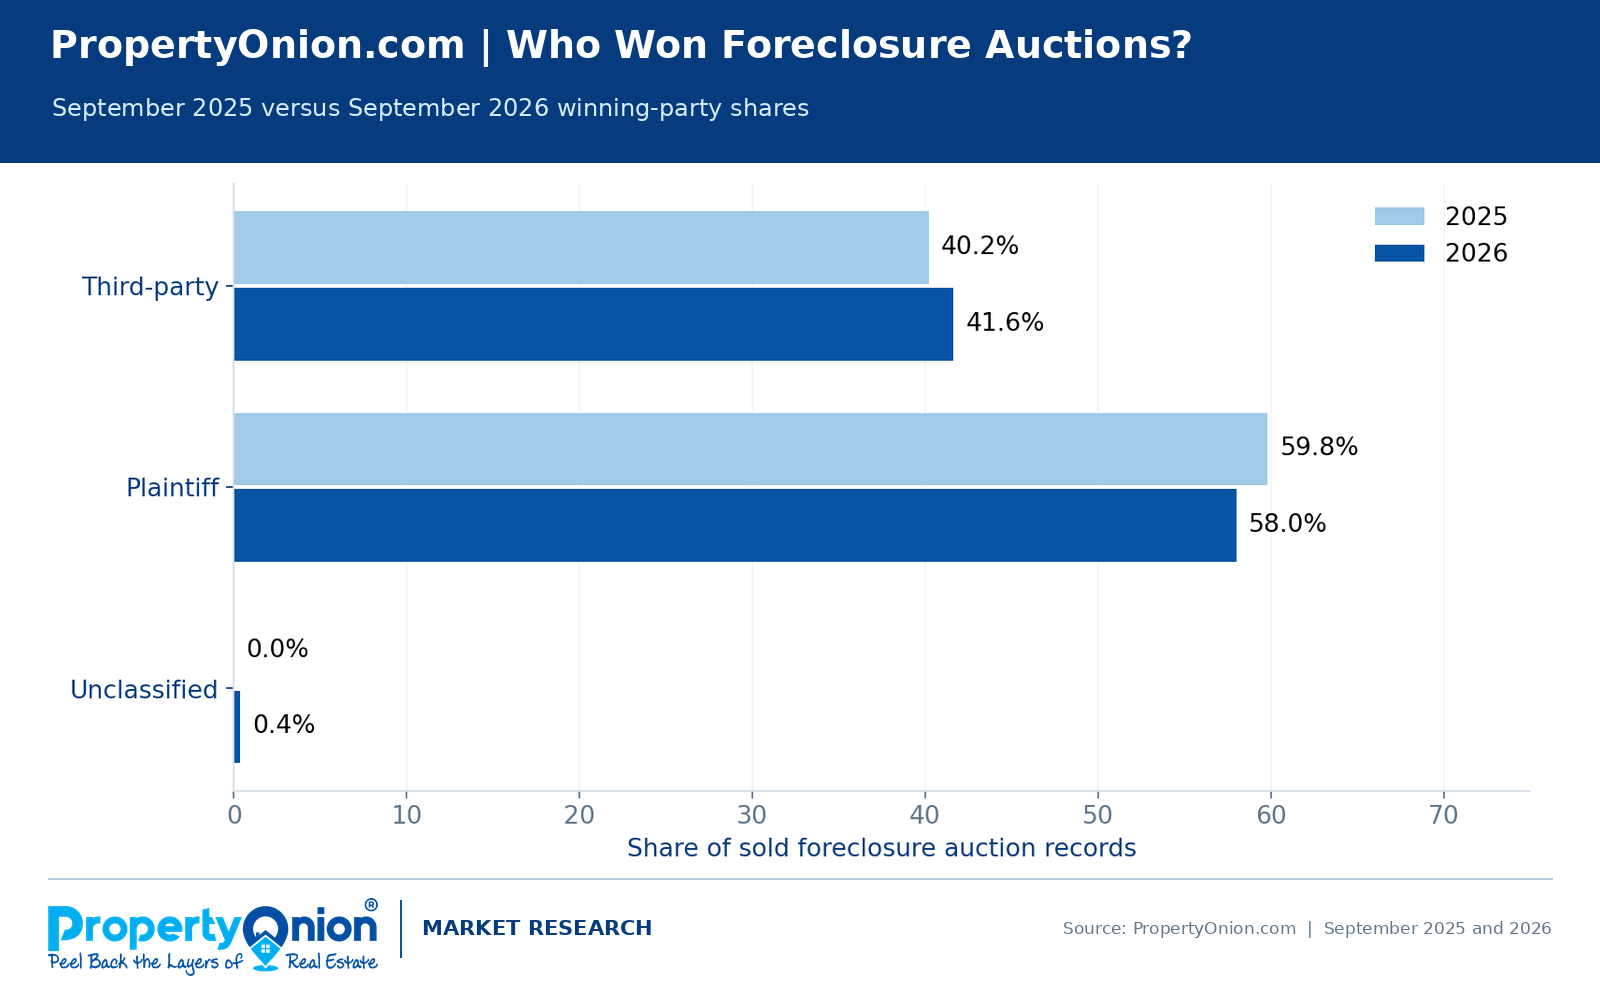
Third-party wins grew 55.9% in number, but their share of reported sales increased more modestly, from 40.2% to 41.6%. Plaintiff wins increased from 415 to 606. This distinction between growth in the number of wins and growth in the share of wins is important when interpreting investor participation.
County-level year-over-year comparison
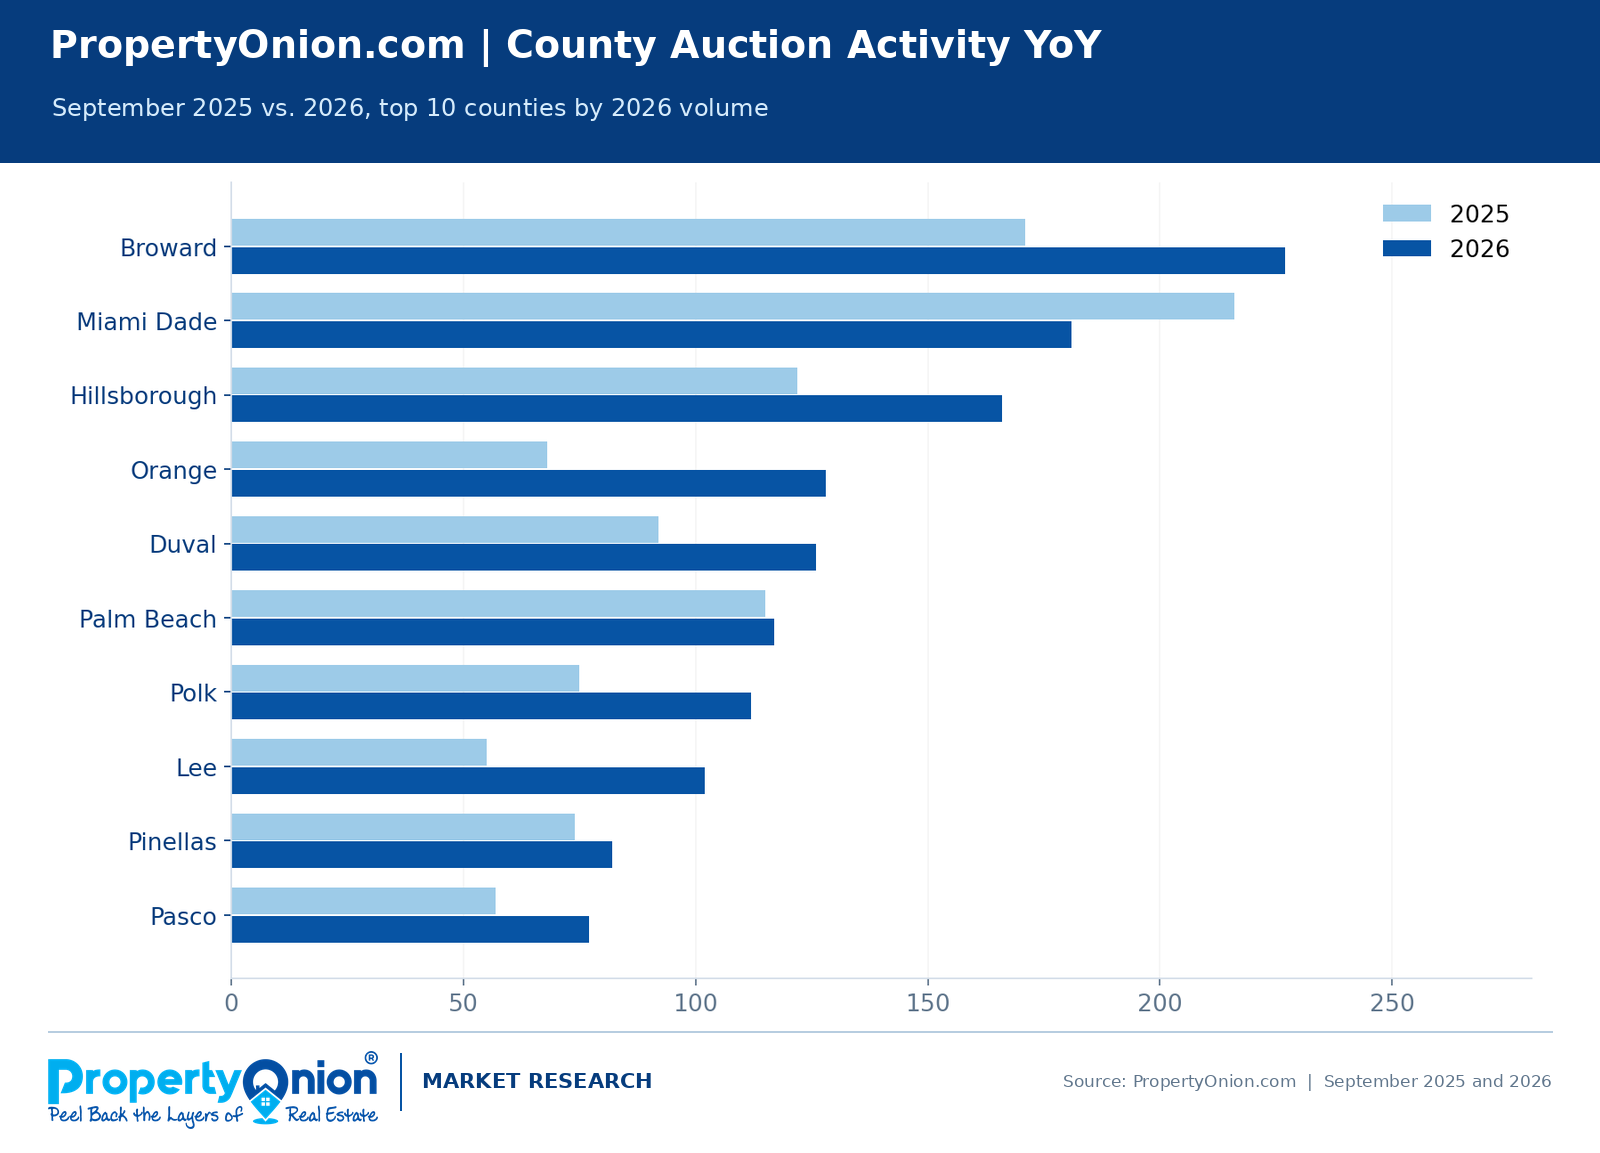
County highlights: Broward increased from 171 to 227 auction records (+32.7%), while Miami-Dade decreased from 216 to 181 (-16.2%). Orange rose from 68 to 128 (+88.2%). The complete county comparison follows; counties missing from one export are labeled rather than treated as having zero auctions.
| County | Sept. 2025 | Sept. 2026 | YoY change |
|---|---|---|---|
| Broward | 171 | 227 | +32.7% |
| Miami Dade | 216 | 181 | -16.2% |
| Hillsborough | 122 | 166 | +36.1% |
| Orange | 68 | 128 | +88.2% |
| Duval | 92 | 126 | +37.0% |
| Palm Beach | 115 | 117 | +1.7% |
| Polk | 75 | 112 | +49.3% |
| Lee | 55 | 102 | +85.5% |
| Pinellas | 74 | 82 | +10.8% |
| Pasco | 57 | 77 | +35.1% |
| Sarasota | 32 | 61 | +90.6% |
| Marion | 48 | 56 | +16.7% |
| Volusia | 48 | 44 | -8.3% |
| Manatee | 17 | 40 | +135.3% |
| Brevard | 37 | 36 | -2.7% |
| Escambia | 29 | 35 | +20.7% |
| Seminole | 29 | 34 | +17.2% |
| Charlotte | 35 | 33 | -5.7% |
| Lake | 30 | 29 | -3.3% |
| St. Lucie | 28 | 25 | -10.7% |
| Alachua | 10 | 22 | +120.0% |
| Bay | 15 | 21 | +40.0% |
| Osceola | 48 | 21 | -56.2% |
| Santa Rosa | 12 | 21 | +75.0% |
| Indian River | 11 | 17 | +54.5% |
| Collier | 8 | 16 | +100.0% |
| Leon | 18 | 15 | -16.7% |
| Okaloosa | – | 15 | N/A |
| St. Johns | 15 | 15 | +0.0% |
| Clay | 34 | 14 | -58.8% |
| Martin | 4 | 14 | +250.0% |
| Hernando | 13 | 13 | +0.0% |
| Walton | 5 | 13 | +160.0% |
| Highlands | – | 12 | N/A |
| Flagler | 10 | 9 | -10.0% |
| Citrus | 11 | 8 | -27.3% |
| Putnam | 8 | 8 | +0.0% |
| Nassau | 7 | 7 | +0.0% |
| Gilchrist | – | 4 | N/A |
| Washington | – | 3 | N/A |
| Jackson | 5 | 2 | -60.0% |
| County not identified in export | – | 1 | N/A |
| Gulf | – | 1 | N/A |
| Okeechobee | 4 | – | N/A |
County coverage note: The September 2025 export represents 38 Florida counties and the September 2026 export represents 43. A county missing from an export is not evidence that the county held no auctions. Year-over-year comparisons may reflect changes in data coverage as well as changes in auction activity.
Winning bid analysis
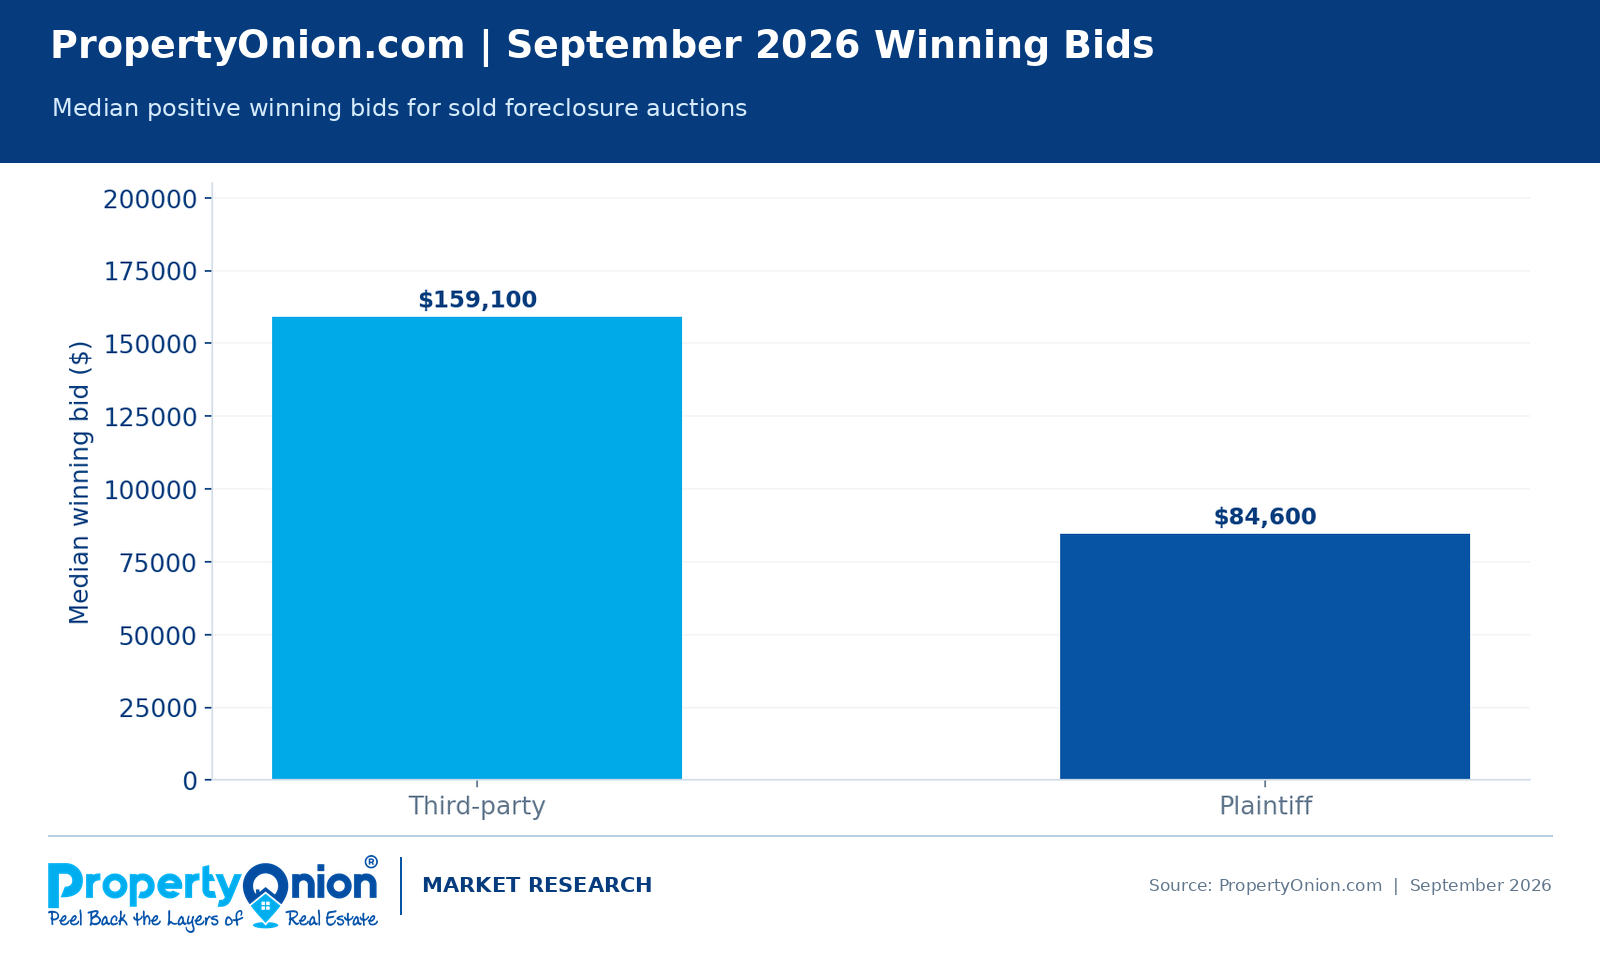
Among sold auctions with a positive reported winning bid, the median third-party winning bid was $159,100, compared with $84,600 for plaintiff wins. These figures are auction bids, not verified arm’s-length real estate sale prices. They should not be used as a proxy for equity or investor profit.
Why foreclosure auctions were canceled
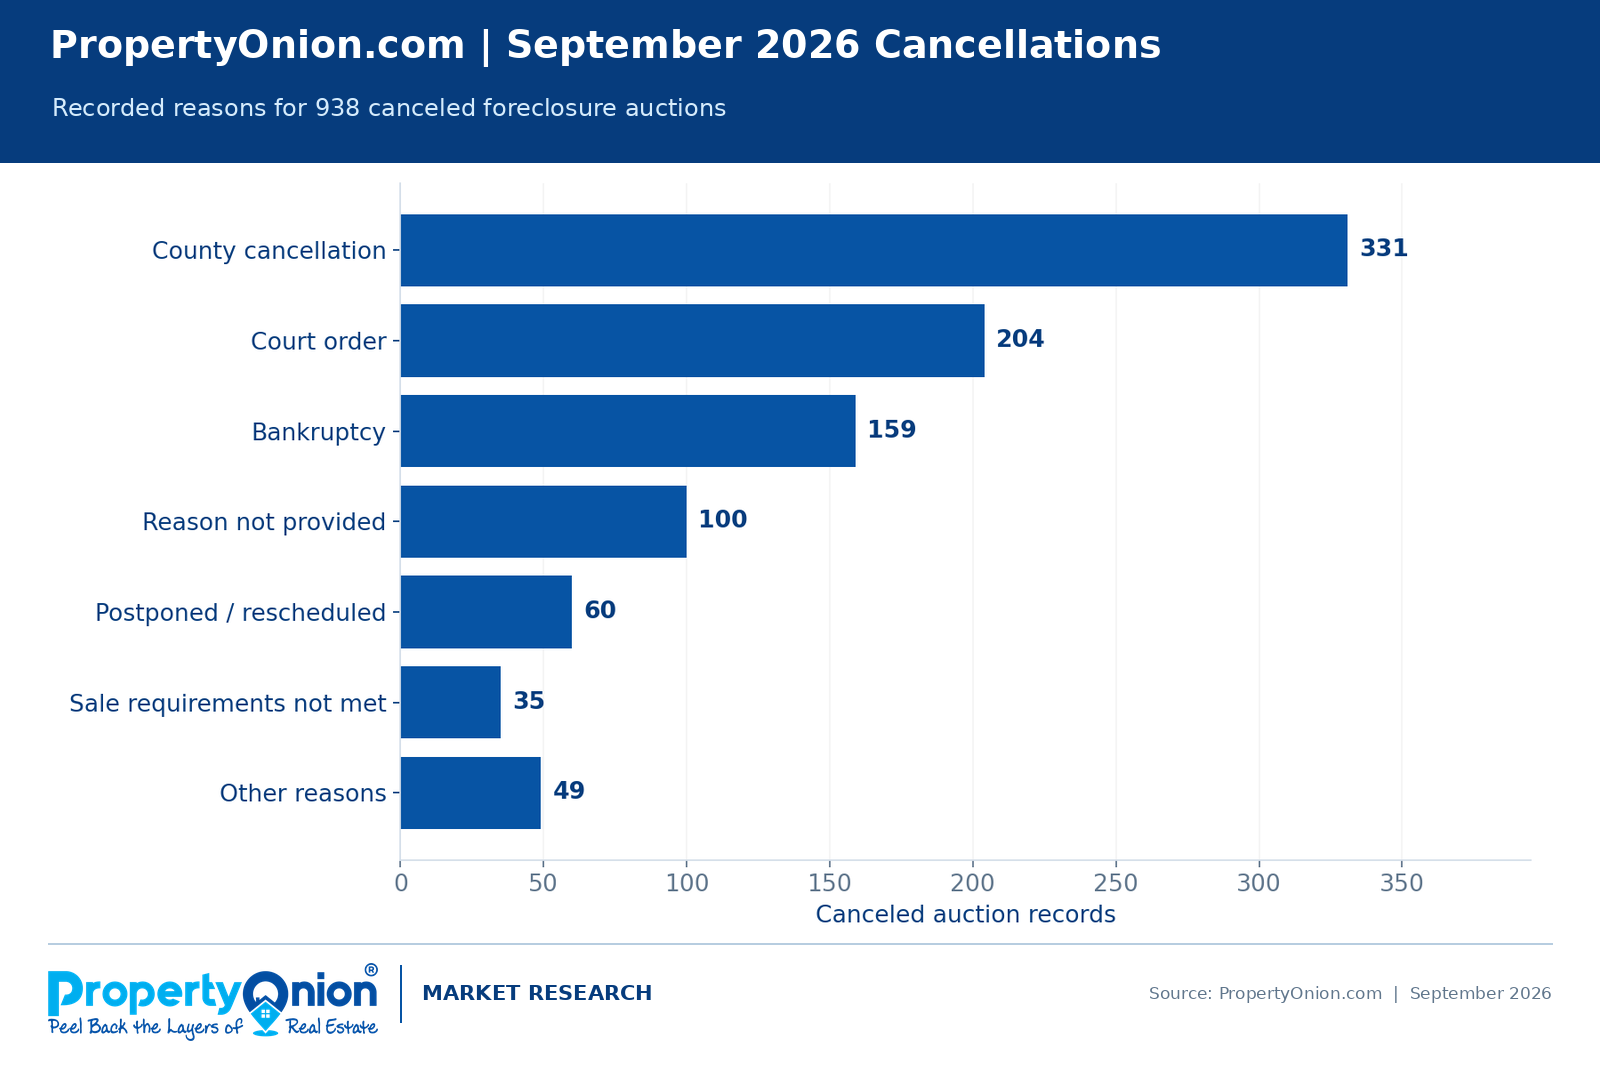
| Recorded cancellation reason | Records |
|---|---|
| County cancellation | 331 |
| Court order | 204 |
| Bankruptcy | 159 |
| Reason not provided | 100 |
| Postponed / rescheduled | 60 |
| Sale requirements not met | 35 |
| Other reasons | 49 |
County cancellations were the largest recorded category, followed by court orders and bankruptcy filings. A canceled auction can be rescheduled or resolved through other legal proceedings, so cancellation counts should not be interpreted as permanently withdrawn properties.
How far below estimated market value are third-party investors buying Florida foreclosures?
PropertyOnion compared third-party foreclosure auction winning bids with estimated property values. For each property, we used PropertyOnion Value (POV) when positive and available; otherwise we used County Market Value. Only records with both a positive valuation and a positive winning bid were included. This comparison measures an apparent discount to estimated value, not verified equity or profit.
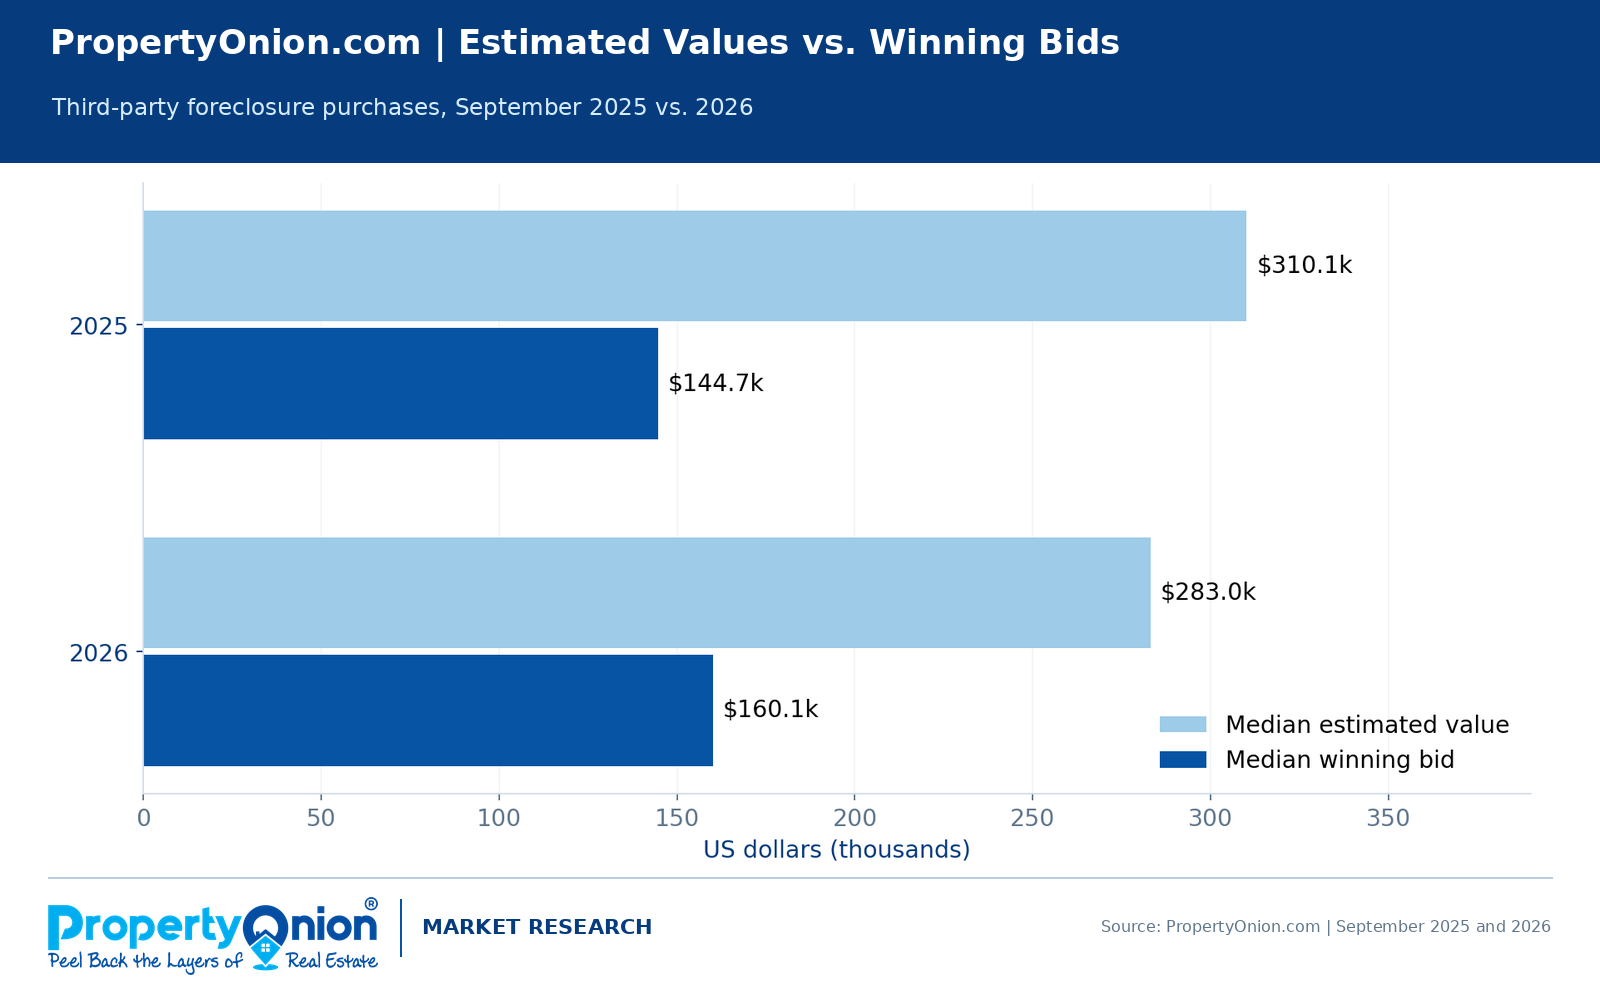
| Third-party purchases | September 2025 | September 2026 |
|---|---|---|
| All third-party wins | 279 | 435 |
| Valid valuation and winning bid | 276 | 428 |
| Used POV | 270 | 423 |
| Used County Market Value fallback | 6 | 5 |
| Median estimated property value | $310,113 | $283,021 |
| Median winning bid | $144,700 | $160,051 |
| Median apparent discount to estimated value | 42.6% | 42.2% |
| Winning bids below estimated value | 265 of 276 (96.0%) | 418 of 428 (97.7%) |
In September 2026, the median apparent discount for qualifying third-party purchases was 42.2%, compared with 42.6% in September 2025. The discount is calculated separately for each property as (estimated value minus winning bid) divided by estimated value, and then the median of those property-level percentages is reported. It is not calculated by dividing the two statewide median figures.
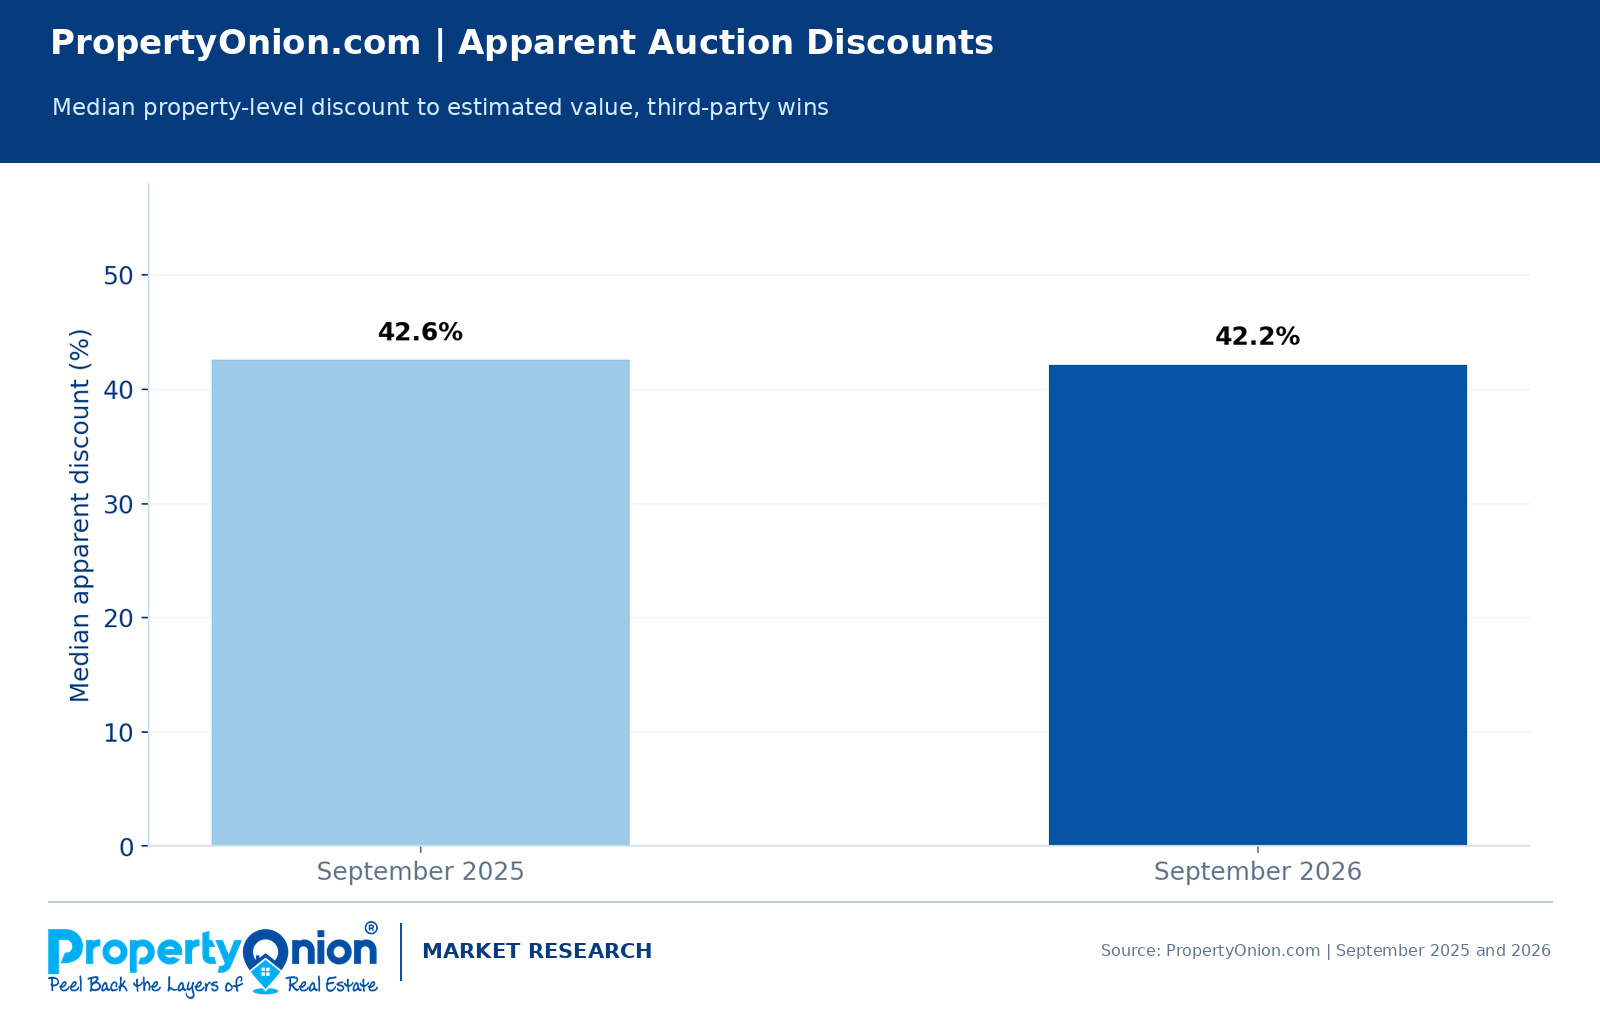
What this means: The 42.2% median apparent discount indicates that reported third-party winning bids were often well below estimated property values in the qualifying dataset. It does not show that investors earned a 42.2% return, and it does not establish that any particular property had that amount of recoverable equity. Title and lien due diligence are essential.
How September 2026 third-party purchases were distributed by apparent discount
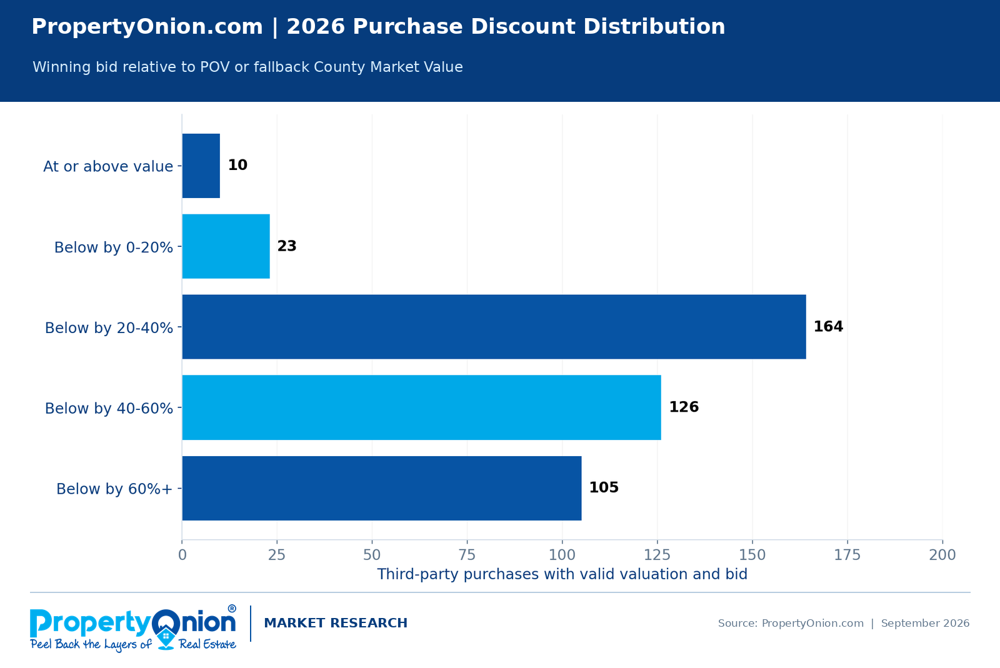
| Winning bid compared with estimated value | Purchases |
|---|---|
| At or above estimated value | 10 |
| Below value by less than 20% | 23 |
| Below value by 20% to less than 40% | 164 |
| Below value by 40% to less than 60% | 126 |
| Below value by 60% or more | 105 |
| Total qualifying third-party purchases | 428 |
Important: A discount to estimated market value is not guaranteed equity or profit
Investor risk disclosure: The apparent discounts shown in this report compare auction winning bids with estimated property values only. They do not account for mortgages or other liens that may survive foreclosure, municipal or code enforcement claims, unpaid taxes or assessments, title defects, property condition, repairs, occupancy, eviction or possession costs, legal fees, closing expenses, or resale costs. Depending on the foreclosure case and lien priority, a third-party purchaser may need to pay, negotiate, litigate, or otherwise resolve surviving encumbrances after the auction. Some encumbrances may not be extinguished by the foreclosure sale. Consequently, a property purchased substantially below its estimated market value may have little or no realizable equity, and an apparent discount should never be interpreted as an investment return.
What happens when the foreclosing plaintiff wins?
A plaintiff win generally means the foreclosing lender or other lienholder, rather than an outside third-party investor, was the successful bidder at the county foreclosure auction. The plaintiff may subsequently obtain title through the applicable foreclosure process. If the plaintiff is a bank or mortgage lender, the property may become real estate owned (REO) and later be listed for sale through a real estate broker, marketed through another sales channel, held, or otherwise disposed of. The outcome depends on the type of lienholder, case circumstances, and completion of the legal process. A plaintiff’s reported winning bid may be based on a credit bid against the debt rather than cash paid for an arm’s-length purchase. For this reason, plaintiff wins are excluded from PropertyOnion’s third-party purchase discount analysis.
What the September data means for investors
More completed sales were recorded. PropertyOnion observed 1,045 completed foreclosure sales in September 2026, compared with 694 in the September 2025 export. This expands the pool of reported transactions available for research, subject to the differences in data coverage.
Third-party activity increased in absolute terms. Outside bidders won 435 auctions, up from 279 a year earlier. However, the winning share moved only modestly, so the data does not prove a dramatic change in bidder competitiveness.
Due diligence remains critical. A winning bid below an estimated property value does not guarantee equity or profit. Surviving liens, title defects, occupancy, condition, and transaction costs can materially affect the outcome.
Frequently asked questions about the September foreclosure data
How many Florida foreclosure auctions sold in September 2026?
PropertyOnion recorded 1,045 sold foreclosure auctions in its September 2026 Florida export, along with 938 canceled auctions. These counts exclude records without a sold or canceled outcome and do not claim to represent every auction statewide.
How many foreclosure auctions were won by third-party investors?
Third-party bidders won 435 of the 1,045 reported sales (41.6%). Plaintiffs won 606 (58.0%), and four sales had no identified winning party in the export.
Are foreclosure auction winning bids 42.2% below market value?
For the 428 September 2026 third-party purchases with a positive winning bid and valid estimated property value, the median property-level apparent discount was 42.2%. PropertyOnion uses POV when available and positive, otherwise County Market Value. The estimate does not account for surviving liens, property condition, or transaction costs and is not a guaranteed discount to realizable market value.
What happens when the foreclosing plaintiff wins?
The foreclosing lender or other lienholder is the successful bidder rather than a third-party investor. Depending on the foreclosure and title process, a lender may later market the property as real estate owned (REO), sell it through another channel, or hold it. Plaintiff credit bids should not be treated as ordinary third-party purchase prices.
Research methodology and limitations
Report publication: October 29, 2026. Research publisher: PropertyOnion.com. Source: PropertyOnion.com auction data exports for September 2025 and September 2026. Scope: Florida foreclosure auction records only, excluding tax deed auctions. Included outcomes: Sold and Canceled. Records without either reported outcome were omitted from every statistic, table, and chart.
Valuation analysis: Only third-party sold foreclosure records with a positive winning bid and a positive estimated value are included. POV is used first, with County Market Value as the fallback if POV is missing or zero. Median discounts are calculated from individual property-level percentages. Valuations are estimates and are not appraisals; surviving liens and transaction costs are not deducted. Coverage: 38 counties in the September 2025 foreclosure export and 43 counties in the September 2026 foreclosure export. These exports should not be treated as a verified census of all Florida foreclosure auctions. Unit of analysis: auction records, not necessarily unique properties or cases across periods. Winner classifications: based on the source export. Winning bid analysis: uses positive reported bid values.
Statistics reflect the data available at the time of extraction. Comparisons may be affected by coverage, record completeness, and later updates. PropertyOnion does not represent these findings as an official statewide government count.
About PropertyOnion Market Research
PropertyOnion Market Research is produced using records maintained in the PropertyOnion auction database. Counts and classifications reflect the exported records and may differ from official county reporting or later updates.
PropertyOnion.com provides auction research, foreclosure property information, and educational resources for real estate investors. PropertyOnion Market Research analyzes auction outcomes and investor activity using data collected for its platform. When citing this research, please credit PropertyOnion.com and link to the original report.




Comments